


The market had a historic week as the benchmark Nifty50 jumped to the much-awaited psychological 20,000 mark. We have seen sector and stock rotation in the last several weeks including banks, technology, engineering, oil & gas and FMCG stocks which have driven this stellar rally of around 3,000 points from March lows.
The Nifty50 has formed a long bullish candlestick pattern on the daily, weekly as well as monthly charts. We have been seeing higher highs, higher lows for the fourth consecutive month.
Further, the Nifty has been consistently respecting the support level of the 13-day EMA (exponential moving average) since April 2023 indicating strong strength of the primary bullish trend. The momentum indicator RSI (relative strength index) has sustained above 65 levels in all the time frames like daily, weekly and monthly indicating strong positive momentum of the index.
"Overall trend looks positive for the Nifty Index, we expect the prices to move higher till 20,200 followed by 20,400 levels in the coming future," Vidnyan Sawant, AVP - technical research at GEPL Capital said, adding the index has strong support at 19,562 (weekly low), followed by 19,200 (key support).
The trend is definitely positive, but considering the one-way rally of the last several sessions, the possibility of some profit-taking can't be ruled out in the near term before we are getting into the next leg of the upmove, experts said.
"Nifty continues to exhibit robust momentum, though caution is warranted as it approaches the psychological level of 20,000, which may trigger profit-booking. Additionally, technical and derivative indicators suggest the market is currently overbought," Pravesh Gour, Senior Technical Analyst at Swastika Investmart said.
Ashish Kyal, CMT, Founder and CEO of Waves Strategy Advisors also says that given the rally has been strong and fast, short-term profit booking is possible as indicators are overbought but not expecting a major correction as of now. "We are seeing different leaders in the space which is a healthy sign. The overall breadth of the market has remained healthy."
On the downside, he is not ruling out a correction of 300 to 500 points on the Nifty but that would be an opportunity to enter the market for many who have been on the sidelines.
Let's take a look at the top 10 trading ideas by experts for the next three-four weeks. Returns are based on the July 20 closing prices:
Expert: Viraj Vyas, CMT, technical & derivatives analyst - institutional equity at Ashika Stock Broking
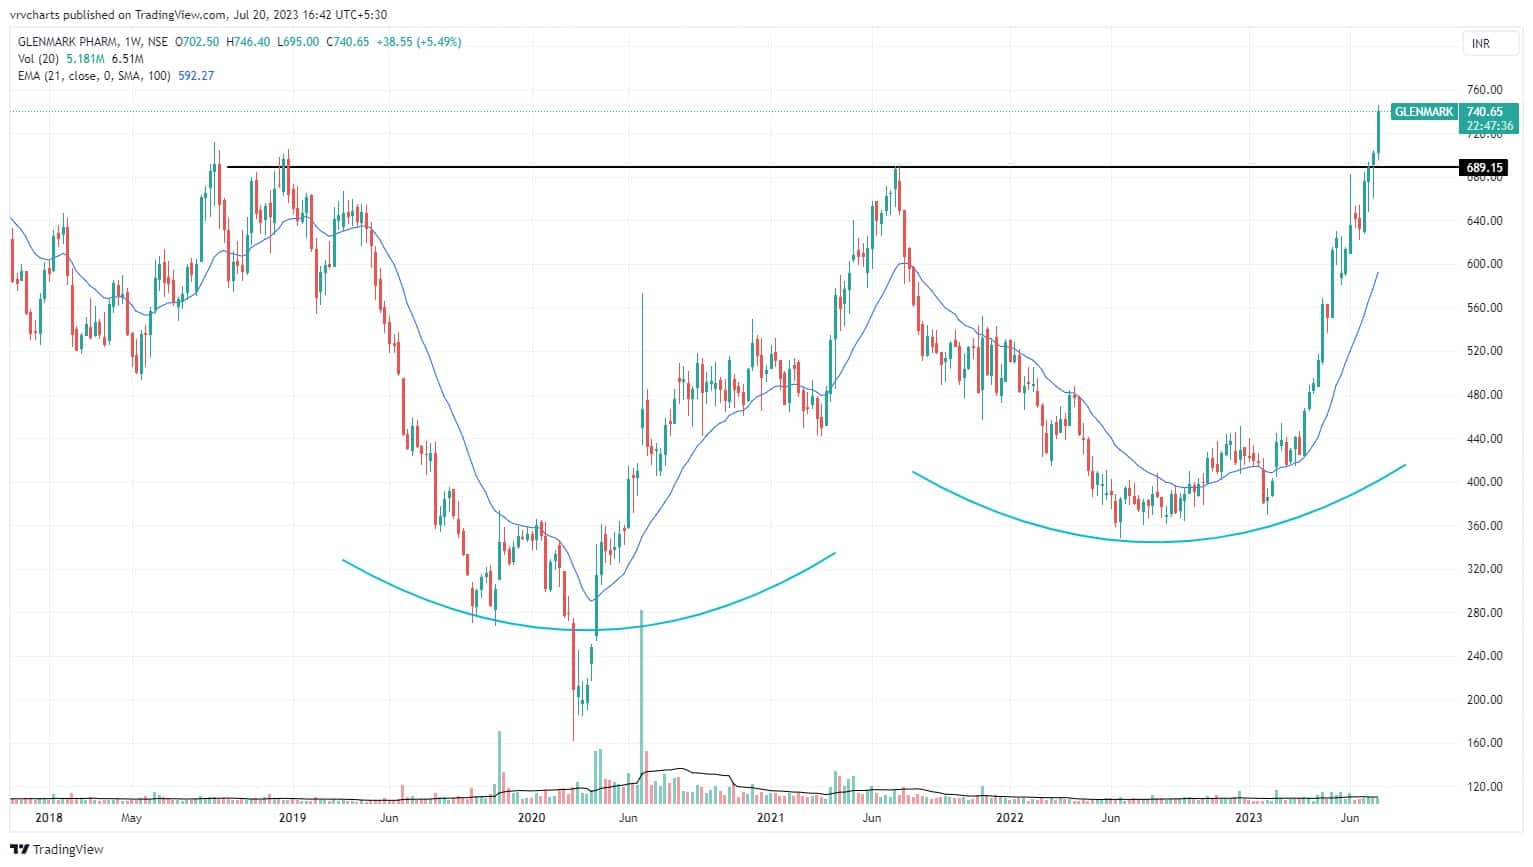
Glenmark Pharma: Buy | LTP: Rs 740 | Stop-Loss: Rs 710 | Target: Rs 830 | Return: 12 percent
The stock has undergone a robust base formation since its decline in 2018, and recently, it achieved a breakout above the 2018 high. This breakout is noteworthy as 2018 marked the top for mid and small stocks, and historically, breaking above 2018 highs has often led to substantial moves of around 10-15 percent in stocks.
Considering the strong base formation and impressive price action after the breakout, the stock appears to be a compelling choice in the pharma sector.
Federal Bank: Buy | LTP: Rs 137 | Stop-Loss: Rs 132 | Target: Rs 160 | Return: 17 percent
The stock exhibited a robust rally from May to November 2022, spanning approximately 30 weeks, followed by a period of sideways trading. During this phase, the stock formed lower highs while finding consistent support in the Rs 125 - 120 zone, resembling a Descending Triangle pattern.
The consolidation phase also lasted around 30 weeks, and currently, the stock is showing signs of a potential breakout, supported by above-average volume participation.

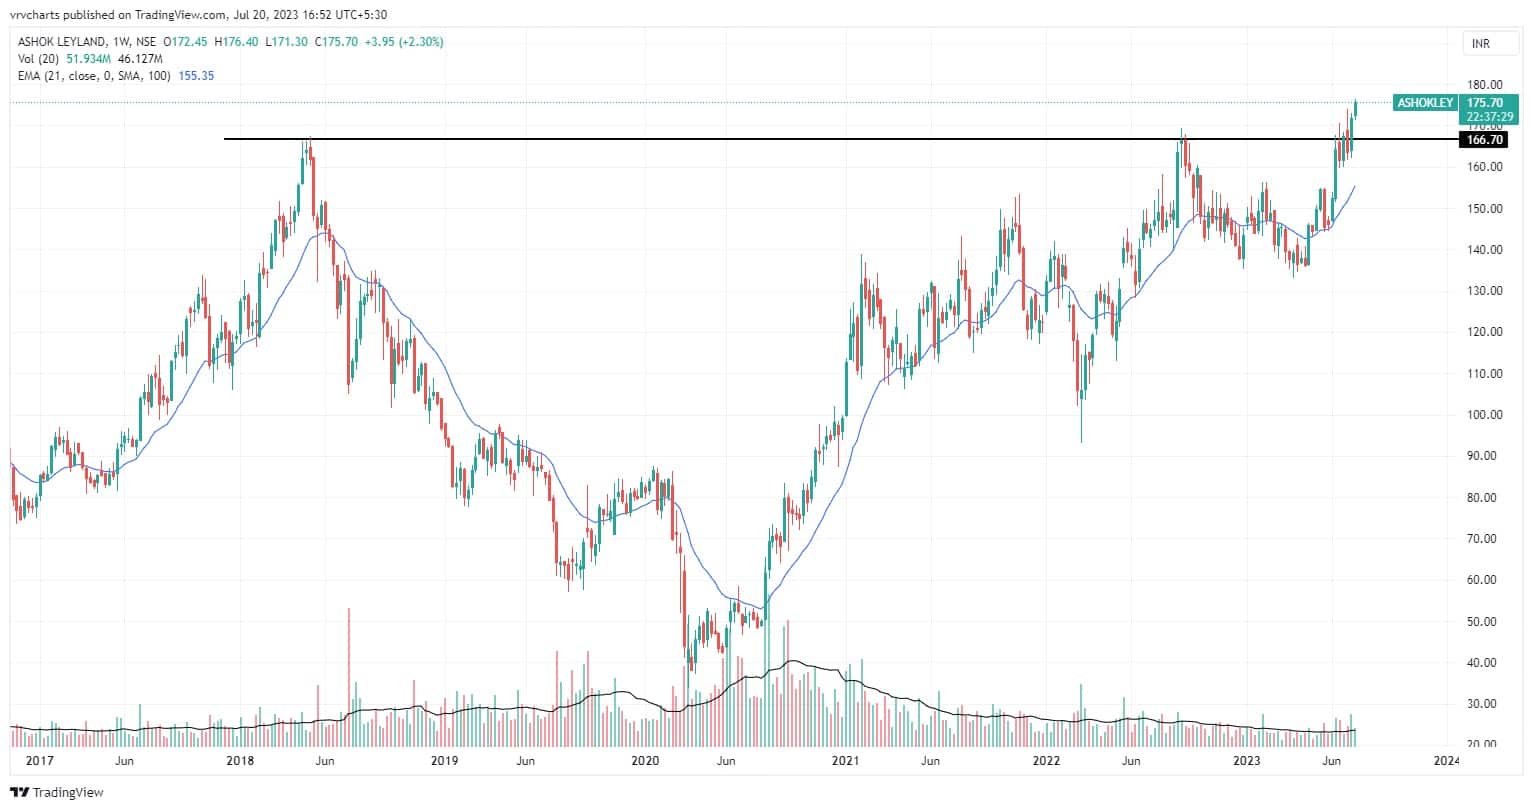
Ashok Leyland: Buy | LTP: Rs 175.7 | Stop-Loss: Rs 165 | Target: Rs 200 | Return: 14 percent
Since 2018, the stock has gone through a tumultuous journey, witnessing significant fluctuations in its price. In September 2022, the stock revisited its all-time high level, and rather than facing a substantial pullback, it displayed a shallow retracement before ultimately surpassing the crucial Rs 167 mark in July 2023.
This breakout above the 2018 highs, combined with the stock's massive base breakout, presents a highly enticing opportunity for investors, making it an appealing choice for a lucrative buy.
The underlying bullish momentum and positive price action further reinforce the potential for this stock's upward trajectory.
Expert: Pravesh Gour, senior technical analyst at Swastika Investmart
Jupiter Wagons: Buy | LTP: Rs 197 | Stop-Loss: Rs 180 | Target: Rs 224 | Return: 14 percent
There is a classical bullish setup as the counter has witnessed a breakout of Bullish Flag formation with strong volume. It is trading above its all-important moving averages.
Momentum indicators are positively poised to support the current strength of the trend. On the upside, Rs 214 and Rs 224 are immediate target levels, while the 9-DMA (moving average) of Rs 180 is an immediate support level below which Rs 177 is the next demand level.

Pitti Engineering: Buy | LTP: Rs 412 | Stop-Loss: Rs 385 | Target: Rs 470 | Return: 14 percent
The counter is in a classical uptrend and now it has broken an ascending triangle formation to resume its uptrend. The breakout coincides with rising volume and it manages to sustain above the breakout level.
It is trading above its all-important moving averages with a positive bias in momentum indicators. On the downside, Rs 385 will act as a strong support level.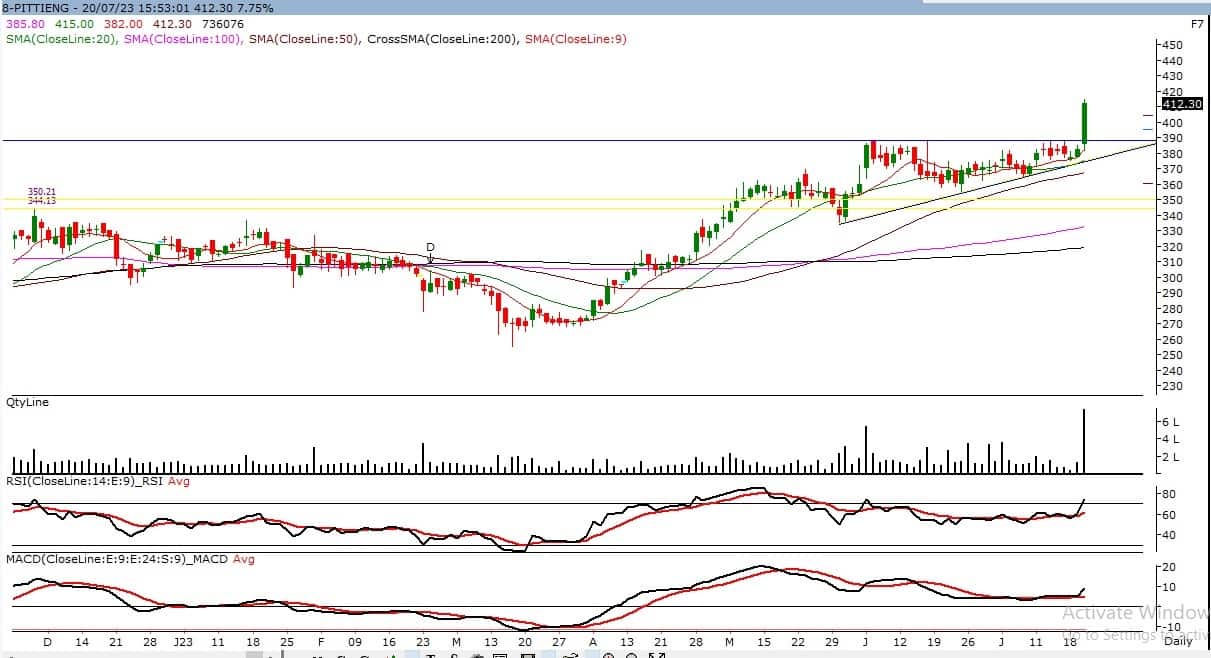
Linde India: Buy | LTP: Rs 4,594 | Stop-Loss: Rs 4,350 | Target: Rs 5,144 | Return: 12 percent
The counter is trying to come out of a long consolidation with strong volume and witnessed a breakout of the triangle pattern. The overall structure of the counter is very Classical on the daily chart. The pattern suggests an immediate target of Rs 5000, while it has the potential to move further upside to Rs 5,144 level.
On the downside, Rs 4,350 will act as an immediate support level. MACD (moving average convergence divergence) is supporting the current strength whereas the momentum indicator RSI (relative strength index) is also positively poised.

Expert: Mitesh Karwa, research analyst at Bonanza Portfolio
State Bank of India: Buy | LTP: Rs 610 | Stop-Loss: Rs 580 | Target: Rs 657 | Return: 8 percent
State Bank of India has seen breaking out of a Cup and Handle pattern on the weekly timeframe with a bullish candlestick and closing above the highs of the last six months with above-average volumes which indicates bullish strength.
On the indicator front, the momentum oscillator RSI (relative strength index 14) is at around 67 on the daily time frame indicating strength by sustaining above 50. Ichimoku Cloud is also suggesting a bullish move as the price is trading above the conversion line, baseline and cloud on the daily timeframe.
Observation of the above factors indicates that a bullish move in SBI is possible for a target of up to Rs 657 in 3-4 weeks. One can initiate a buy trade in the range of Rs 606-610 with a stop-loss of Rs 580 on a daily closing basis.

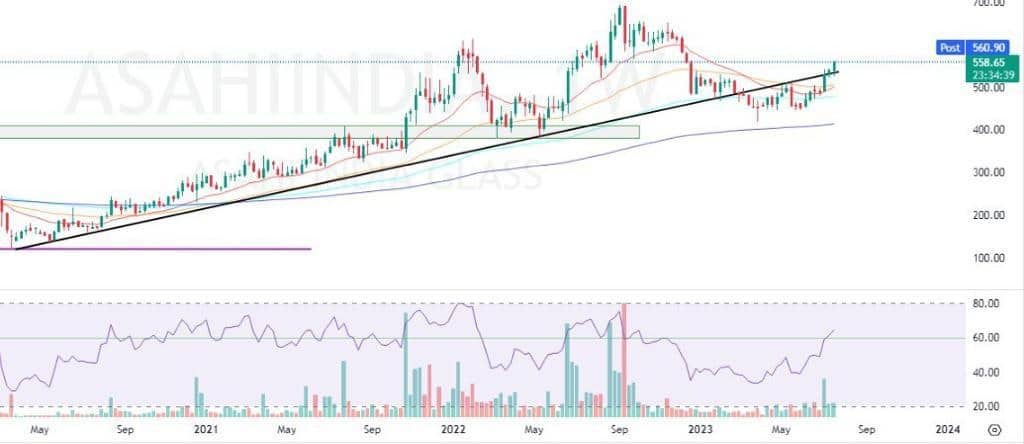
Asahi India Glass: Buy | LTP: Rs 558.65 | Stop-Loss: Rs 496 | Target: Rs 650 | Return: 16 percent
Asahi India Glass has seen giving a false breakdown on the weekly timeframe and closing with a bullish candlestick above the highs of the last six months and closing above all its important EMAs which indicates bullish strength.
On the indicator front, the momentum oscillator RSI (14) is at around 70 showing strength by sustaining above 50. The Supertrend indicator is indicating a bullish continuation and the Ichimoku Cloud is also indicating strength as the price is trading above the conversion line and baseline.
Observation of the above factors indicates that a bullish move in Asahi India Glass is possible for a target of up to Rs 650. One can initiate a buy trade in between the range of Rs 554-558, with a stop-loss of Rs 496 on a daily closing basis.
Expert: Vidnyan Sawant, AVP - technical research at GEPL Capital
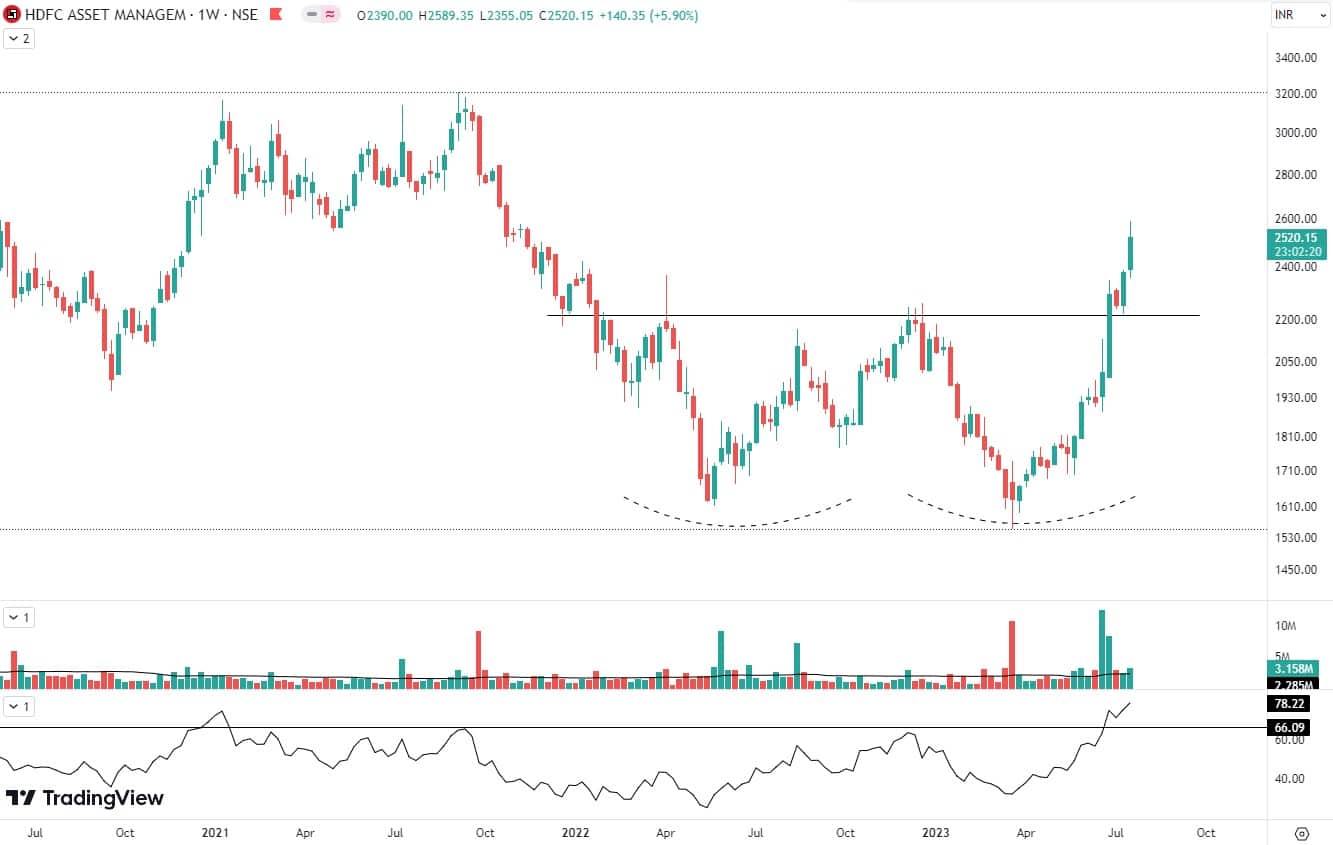
HDFC Asset Management Company: Buy | LTP: Rs 2,520 | Stop-Loss: Rs 2,350 | Target: Rs 2,950 | Return: 17 percent
HDFC AMC stock, after experiencing a correction since December 2019, has established a solid support base ranging from Rs 1,610 on the lower side to Rs 2,250 on the higher side.
Recently, the stock broke out of the Double Bottom pattern, indicating the beginning of an upward trend.
On the daily timeframe, HDFC AMC stock is currently trading above important moving averages, specifically the 50-day and 200-day exponential moving averages (EMA). This confirms the presence of an uptrend in the stock's price.
Moreover, the relative strength index (RSI) on the weekly timeframe is showing positive momentum, as it has risen and sustained well above the 60 mark.
Based on our analysis, we anticipate that the prices of HDFC AMC will continue to rise towards Rs 2,950 level. It is crucial to strictly maintain a stop-loss at Rs 2,350, based on the closing prices.
Century Textiles and Industries: Buy | LTP: Rs 971.75 | Stop-Loss: Rs 900 | Target: Rs 1,120 | Return: 15 percent
Century Textiles stock is currently demonstrating strong momentum as it is approaching record highs. In addition, a breakout of the bearish channel on the weekly timeframe in late June 2023 suggests a continuation of the upward trend.
Furthermore, the RSI has shown a breakout, indicating increasing momentum in the stock's price. Given these compelling factors, it can be inferred that Century Textiles stock is displaying robust performance.
Looking ahead, we anticipate the prices to climb towards Rs 1,120 level. It is recommended to set a stop-loss at Rs 900 based on closing prices to effectively manage potential downside risks.

Disclaimer: The views and investment tips expressed by investment experts on Moneycontrol.com are their own and not those of the website or its management. Moneycontrol.com advises users to check with certified experts before taking any investment decisions.
Discover the latest Business News, Sensex, and Nifty updates. Obtain Personal Finance insights, tax queries, and expert opinions on Moneycontrol or download the Moneycontrol App to stay updated!
Find the best of Al News in one place, specially curated for you every weekend.
Stay on top of the latest tech trends and biggest startup news.


