
In this column, we will be discussing more about Technical Indicators i.e Money Flow Index and Bollinger Bands. Money Flow Index (MFI) is a technical oscillator that uses price and volume to identify overbought or oversold conditions in an asset. It can also be used to spot divergences which warn of a trend change in price.
Meanwhile Bollinger Bands are a type of statistical chart characterising the prices and volatility over time of a financial instrument or commodity.
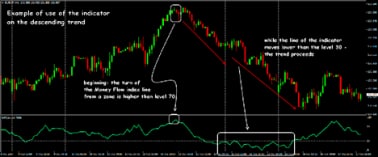
a) Money Flow Index (MFI):
The Money Flow Index (MFI) is an oscillator that uses both price and volume to measure buying and selling pressure. MFI is also known as volume-weighted RSI. MFI starts with the typical price for each period. Money flow is positive when the typical price rises (buying pressure) and negative when the typical price declines (selling pressure).
A ratio of positive and negative money flow is then plugged into an RSI formula to create an oscillator that moves between zero and one hundred. As a momentum oscillator tied to volume, MFI is best suited to identify reversals and price extremes with a variety of signals.
b) Bollinger Bands:
Bollinger Bands are volatility bands placed above and below a moving average. Volatility is based on the standard deviation, which changes as volatility increases and decreases. The bands automatically widens when volatility increases and contracts when volatility decreases.
Their dynamic nature allows them to be used on different securities with the standard settings. For signals, Bollinger Bands can be used to identify M-Tops and W-Bottoms or to determine the strength of the trend.
(The author is Associate Vice President, Analyst-Derivatives at Motilal Oswal Financial Services Limited. )
Disclaimer: The views and investment tips expressed by investment experts on moneycontrol.com are their own, and not that of the website or its management. Moneycontrol.com advises users to check with certified experts before taking any investment decisions.
Discover the latest Business News, Sensex, and Nifty updates. Obtain Personal Finance insights, tax queries, and expert opinions on Moneycontrol or download the Moneycontrol App to stay updated!