


Led by buying in banking & financial services, auto, FMCG, and technology stocks, the benchmark indices recouped more than half of previous day's losses, rising eight-tenth of a percent on October 12. In fact, majority of stocks available for trading in F&O saw long build-up and short-covering on Wednesday.
The BSE Sensex climbed 479 points to 57,626, and the Nifty50 jumped 140 points to 17,124 and formed bullish candle or inside bar kind of pattern formation on the daily charts.
The broader markets also followed suit with the Nifty Midcap 100 and Smallcap 100 indices rising 0.6 percent and 0.8 percent respectively. India VIX fell by 1.53 percent to 20.18 levels, making the trend favourable for bulls.
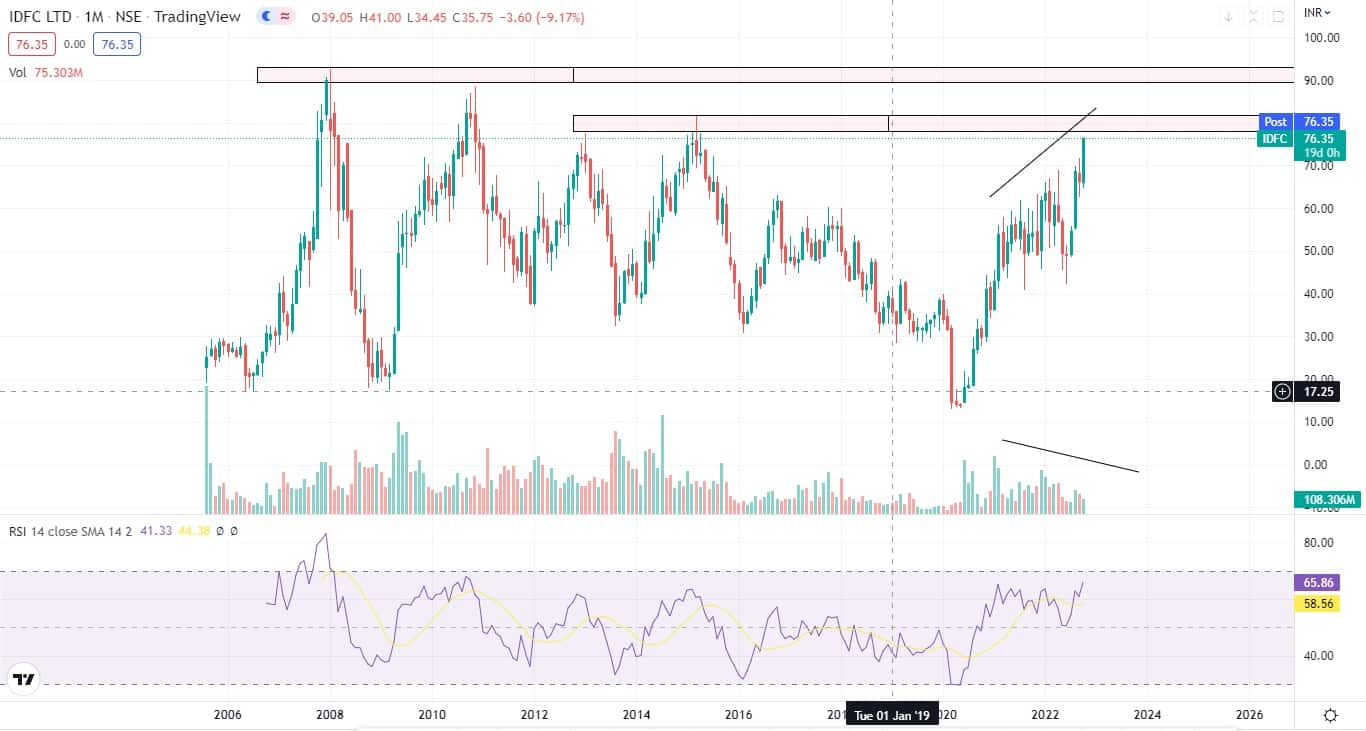
Stocks that were in action and performed better than broader markets included IDFC, which rose 5 percent to Rs 76.35 and formed strong bullish candle on the daily charts with large volumes, while JBM Auto rallied nearly 12 percent to Rs 450.65, forming robust bullish candle on the daily charts with large volumes.
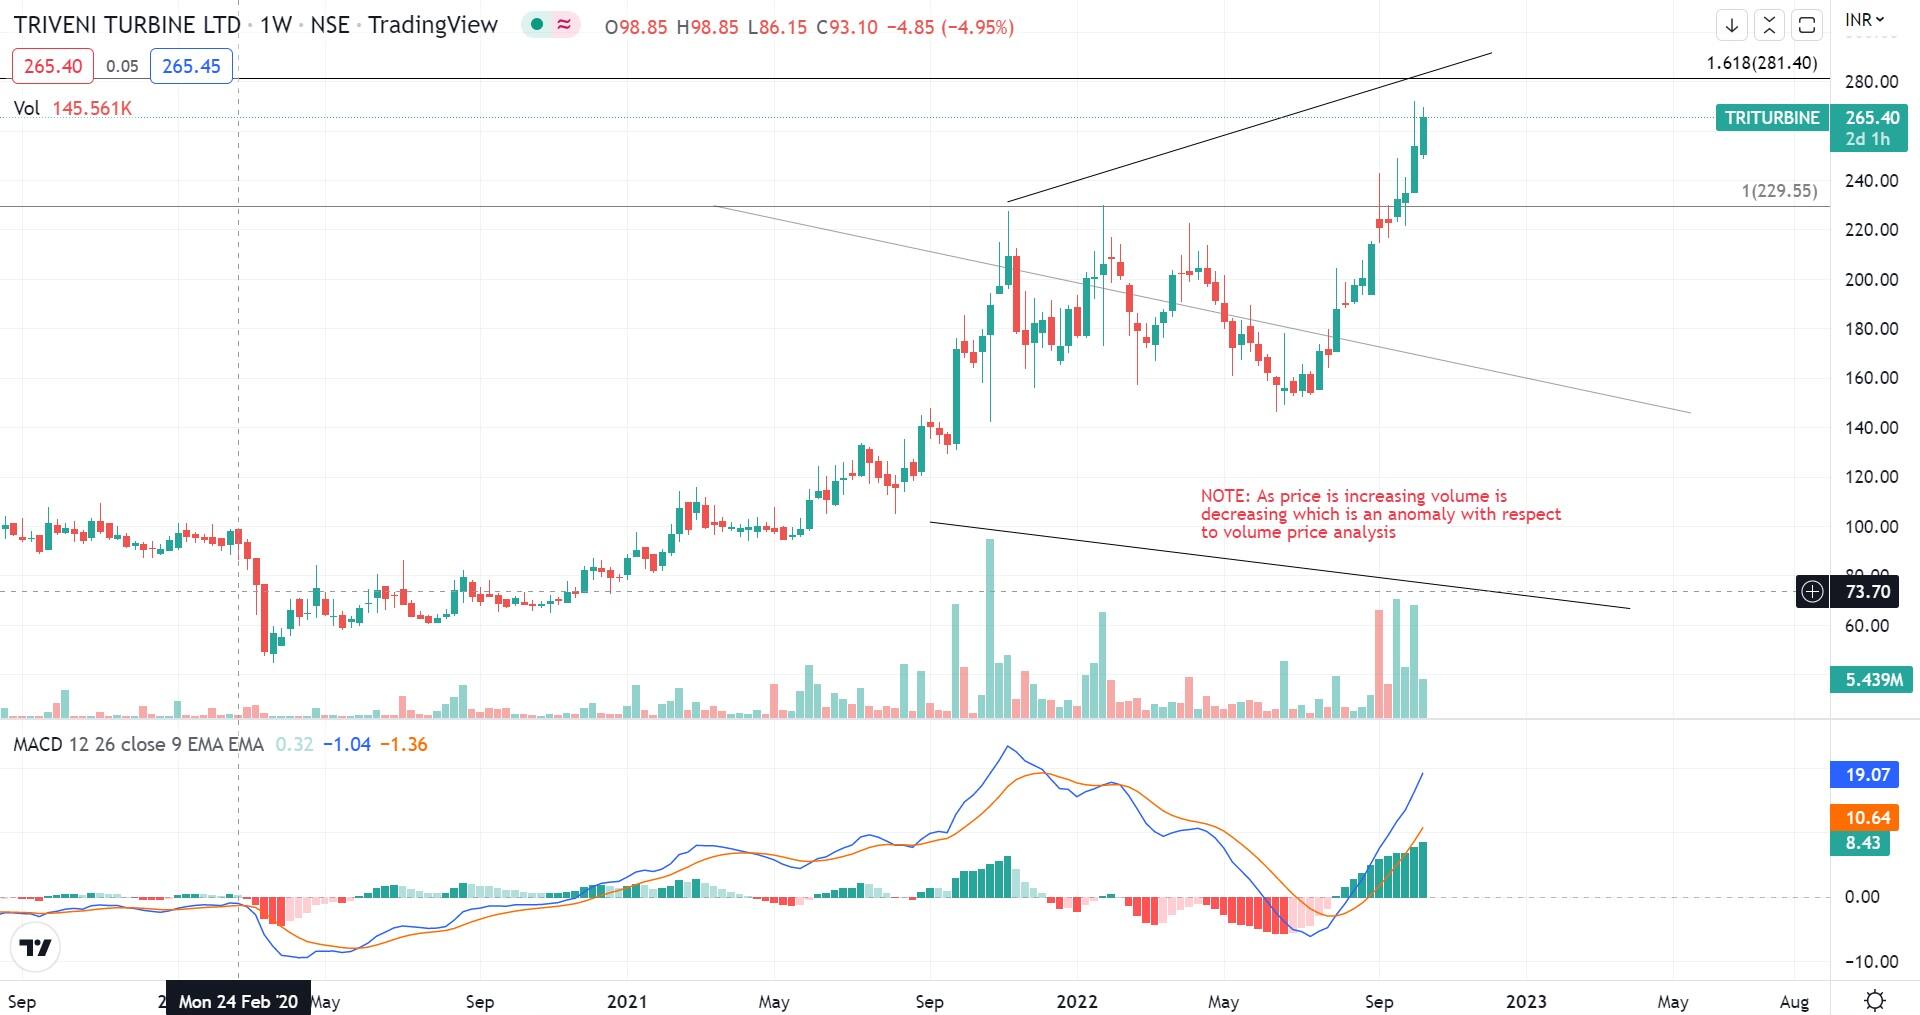
Triveni Turbine shares gained nearly 5 percent to Rs 266.30, trading near all-time high and formed bullish candlestick pattern on the daily charts. On monthly charts, there was Three White Soldiers kind of pattern formation.
Here's what Jigar S Patel of Anand Rathi Shares & Stock Brokers recommends investors should do with these stocks when the market resumes trading today:
Since the last 3 months, Triveni Turbine has appreciated approximately 86 percent. At current juncture it is trading near its crucial resistance zone of Rs 270-280 which also near 1.618 extension (one of the extreme ratios in harmonic arsenal).
Also volume is dropping as price is increasing which is an anomaly with respect to volume price analysis (refer chart).
On the indicator front, weekly MACD (moving average convergence and divergence) is overstretched which is a sign of early caution.
One can book some profits at current levels and other higher levels (i.e Rs 280) if achieved. Fresh buying as of now is not advised.
JBM Auto has witnessed a very sharp correction of 46 percent in the last 8 months. On weekly scale, it has proven Rs 380-400 as solid support because it has been tested multiple times along with rising volume which is adding more confirmation for further upside momentum.
On indicator front, weekly MACD has made bullish cross along with weekly RSI bouncing back from 40 levels which is adding more validation for upside in coming days.
One can buy at current current market price in small tranche and another tranche at Rs 430 (if tested again). The upside is seen till Rs 520 with credible support seen at Rs 400.

Between June 2022 and till date, IDFC has appreciated approximately 81 percent. At current juncture, it is hovering near its crucial resistance zone of Rs 80-82 which are its previous historical tops. Also volume is dropping as price is increasing which is an abnormality with respect to volume price analysis (refer chart).
On the Indicator front weekly MACD is overstretched which is a sign of early caution. One can book some profits at current levels and other higher levels (i.e Rs 82-84) if achieved. Fresh buying as of now is not advised.
Disclaimer: The views and investment tips expressed by investment experts on Moneycontrol.com are their own and not those of the website or its management. Moneycontrol.com advises users to check with certified experts before taking any investment decisions.
Discover the latest Business News, Sensex, and Nifty updates. Obtain Personal Finance insights, tax queries, and expert opinions on Moneycontrol or download the Moneycontrol App to stay updated!
Find the best of Al News in one place, specially curated for you every weekend.
Stay on top of the latest tech trends and biggest startup news.


