


The late trade recovery helped the Nifty 50 close at a more than two-week high, i.e., above 25,900, especially after the mandate for the NDA in the Bihar elections, up 0.1 percent on November 14, with strengthening technical and momentum indicators. As long as the index sustains above 25,700, the upward journey toward the 26,000–26,100 hurdle is possible in the upcoming sessions; however, falling below this can bring the index toward the crucial support of the 25,500–25,450 zone, according to experts.

Here are 15 data points we have collated to help you spot profitable trades:
1) Key Levels For The Nifty 50 (25,910)
Resistance based on pivot points: 25,940, 25,987, and 26,063
Support based on pivot points: 25,788, 25,740, and 25,664
Special Formation: The Nifty 50 formed a long bullish candle on the daily charts with above-average volumes, sustaining above all key moving averages and in the upper Bollinger Band. The short-term moving averages trended upward. The RSI stayed above the 60 level at 62.24 with a bullish crossover, and the Stochastic RSI remained in a positive crossover. The histogram inched closer to the zero line, and the MACD inclined toward the reference line. All this indicates strengthening bullish momentum and the potential for continued upside in the near term.
2) Key Levels For The Bank Nifty (58,518)
Resistance based on pivot points: 58,592, 58,720, and 58,926
Support based on pivot points: 58,180, 58,052, and 57,846
Resistance based on Fibonacci retracement: 58,735, 60,142
Support based on Fibonacci retracement: 57,430, 56,688
Special Formation: The Bank Nifty sustained above the falling trendline (which was resistance earlier and now acts as support) for the third straight session and reached the upper line of the Bollinger Band, forming a long bullish candle on the daily timeframe. The index ended at a new closing high with 0.23 percent gains, sustaining above all key moving averages. The RSI, at 67.08, showed a positive crossover, and the Stochastic RSI sustained its bullish crossover. The MACD histogram weakness has consistently been fading. All this indicates a continuation of the prevailing uptrend with strong buying interest and supportive momentum.

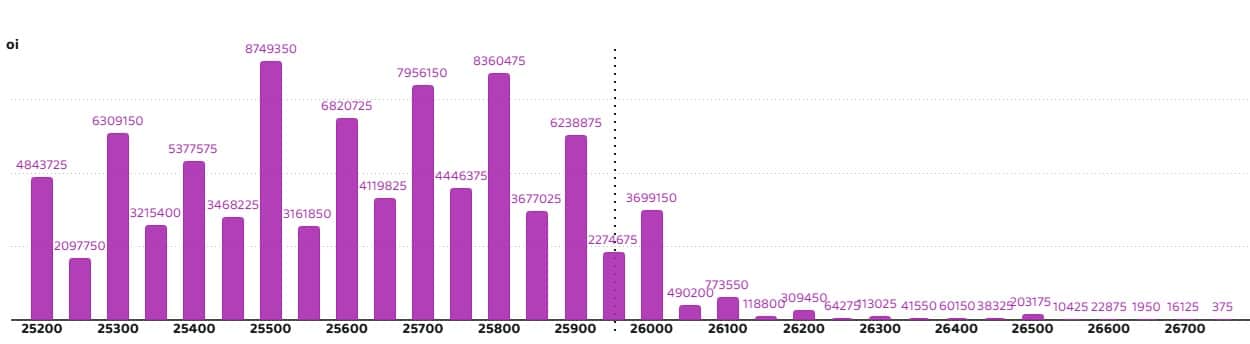
According to the weekly options data, the maximum Call open interest was seen at the 26,000 strike (with 1.36 crore contracts). This level can act as a key resistance for the Nifty in the short term. It was followed by the 26,500 strike (1.03 crore contracts) and 26,200 strike (91.6 lakh contracts).
Maximum Call writing was observed at the 26,000 strike, which saw an addition of 43.69 lakh contracts, followed by the 25,800 and 26,300 strikes, which added 35.94 lakh and 34.86 lakh contracts, respectively. The maximum Call unwinding was seen at the 25,500 strike, which shed 1.12 lakh contracts, followed by the 25,400 and 25,600 strikes, which shed 1.1 lakh and 98,325 contracts, respectively.

On the Put side, the 25,500 strike holds the maximum Put open interest (with 87.49 lakh contracts), which can act as a key support level for the Nifty. It was followed by the 25,800 strike (83.6 lakh contracts) and the 25,700 strike (79.56 lakh contracts).
The maximum Put writing was placed at the 25,700 strike, which saw an addition of 32.85 lakh contracts, followed by the 25,750 and 25,600 strikes, which added 21.45 lakh and 20.66 lakh contracts, respectively. The maximum Put unwinding was seen at the 26,500 strike which shed 55,500 contracts, followed by the 26,200 and 26,300 strikes, which shed 48,675 and 39,375 contracts, respectively.
5) Bank Nifty Call Options Data
According to the monthly options data, the 58,500 strike holds the maximum Call open interest, with 19.33 lakh contracts. This can act as a key level for the index in the short term. It was followed by the 60,000 strike (12.32 lakh contracts) and the 59,000 strike (11.64 lakh contracts).
Maximum Call writing was observed at the 58,500 strike (with the addition of 2.88 lakh contracts), followed by the 59,000 strike (92,225 contracts) and 60,000 strike (88,585 contracts). The maximum Call unwinding was seen at the 58,000 strike, which shed 2.43 lakh contracts, followed by the 58,200 and 58,400 strikes, which shed 46,270 and 40,215 contracts, respectively.

6) Bank Nifty Put Options Data
On the Put side, the maximum Put open interest was seen at the 58,500 strike (with 17.3 lakh contracts), which can act as a key level for the index. This was followed by the 58,000 strike (14.55 lakh contracts) and the 57,000 strike (11.77 lakh contracts).
The maximum Put writing was placed at the 58,500 strike (which added 1.32 lakh contracts), followed by the 56,800 strike (36,155 contracts) and the 58,600 strike (31,640 contracts). The maximum Put unwinding was seen at the 58,400 strike which shed 44,660 contracts, followed by the 57,700 and 57,800 strikes, which shed 36,995 and 25,060 contracts, respectively.

The Nifty Put-Call ratio (PCR), which indicates the mood of the market, dropped to 0.92 on November 14, compared to 1.1 in the previous session.
The increasing PCR, or being higher than 0.7 or surpassing 1, means traders are selling more Put options than Call options, which generally indicates the firming up of a bullish sentiment in the market. If the ratio falls below 0.7 or moves towards 0.5, then it indicates selling in Calls is higher than selling in Puts, reflecting a bearish mood in the market.

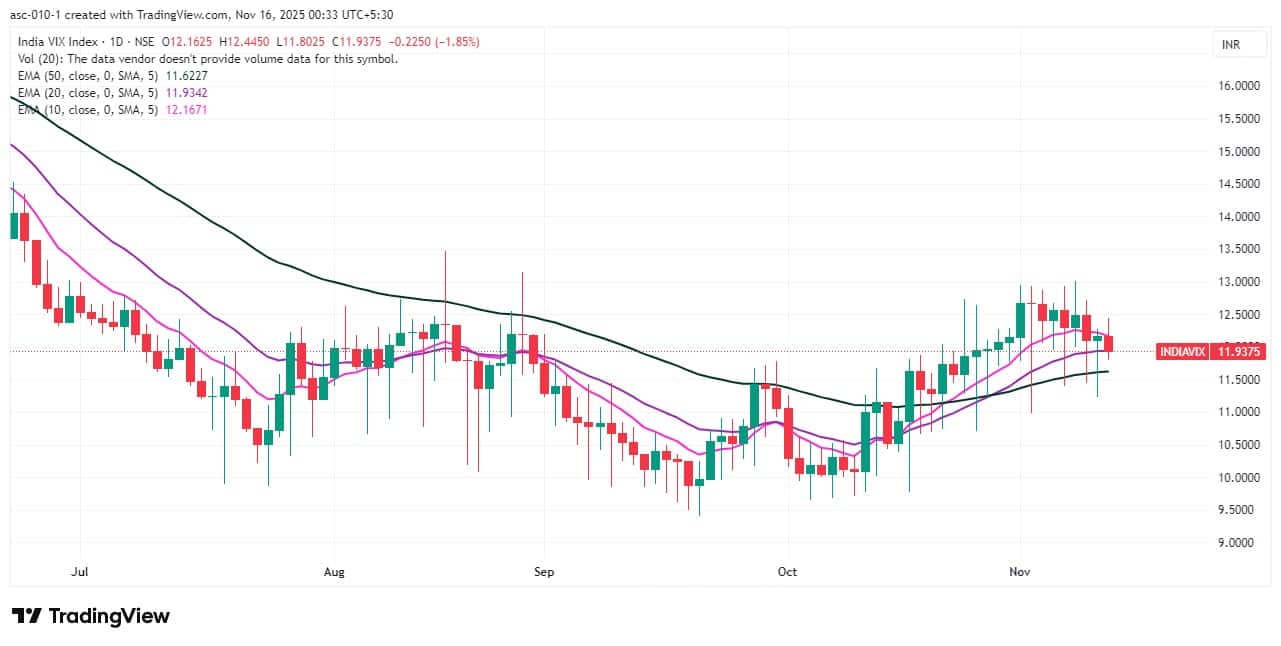
9) India VIX
The India VIX, known as the fear gauge, dropped to 11.94 on Friday, down 1.85 percent and falling below the 10- and 100-day EMAs, providing comfort for bulls. Bulls may get into a strong comfort zone if VIX falls and sustains below all key moving averages, experts said.
A long build-up was seen in 76 stocks. An increase in open interest (OI) and price indicates a build-up of long positions.

11) Long Unwinding (43 Stocks)
43 stocks saw a decline in open interest (OI) along with a fall in price, indicating long unwinding.

12) Short Build-up (53 Stocks)
53 stocks saw an increase in OI along with a fall in price, indicating a build-up of short positions.

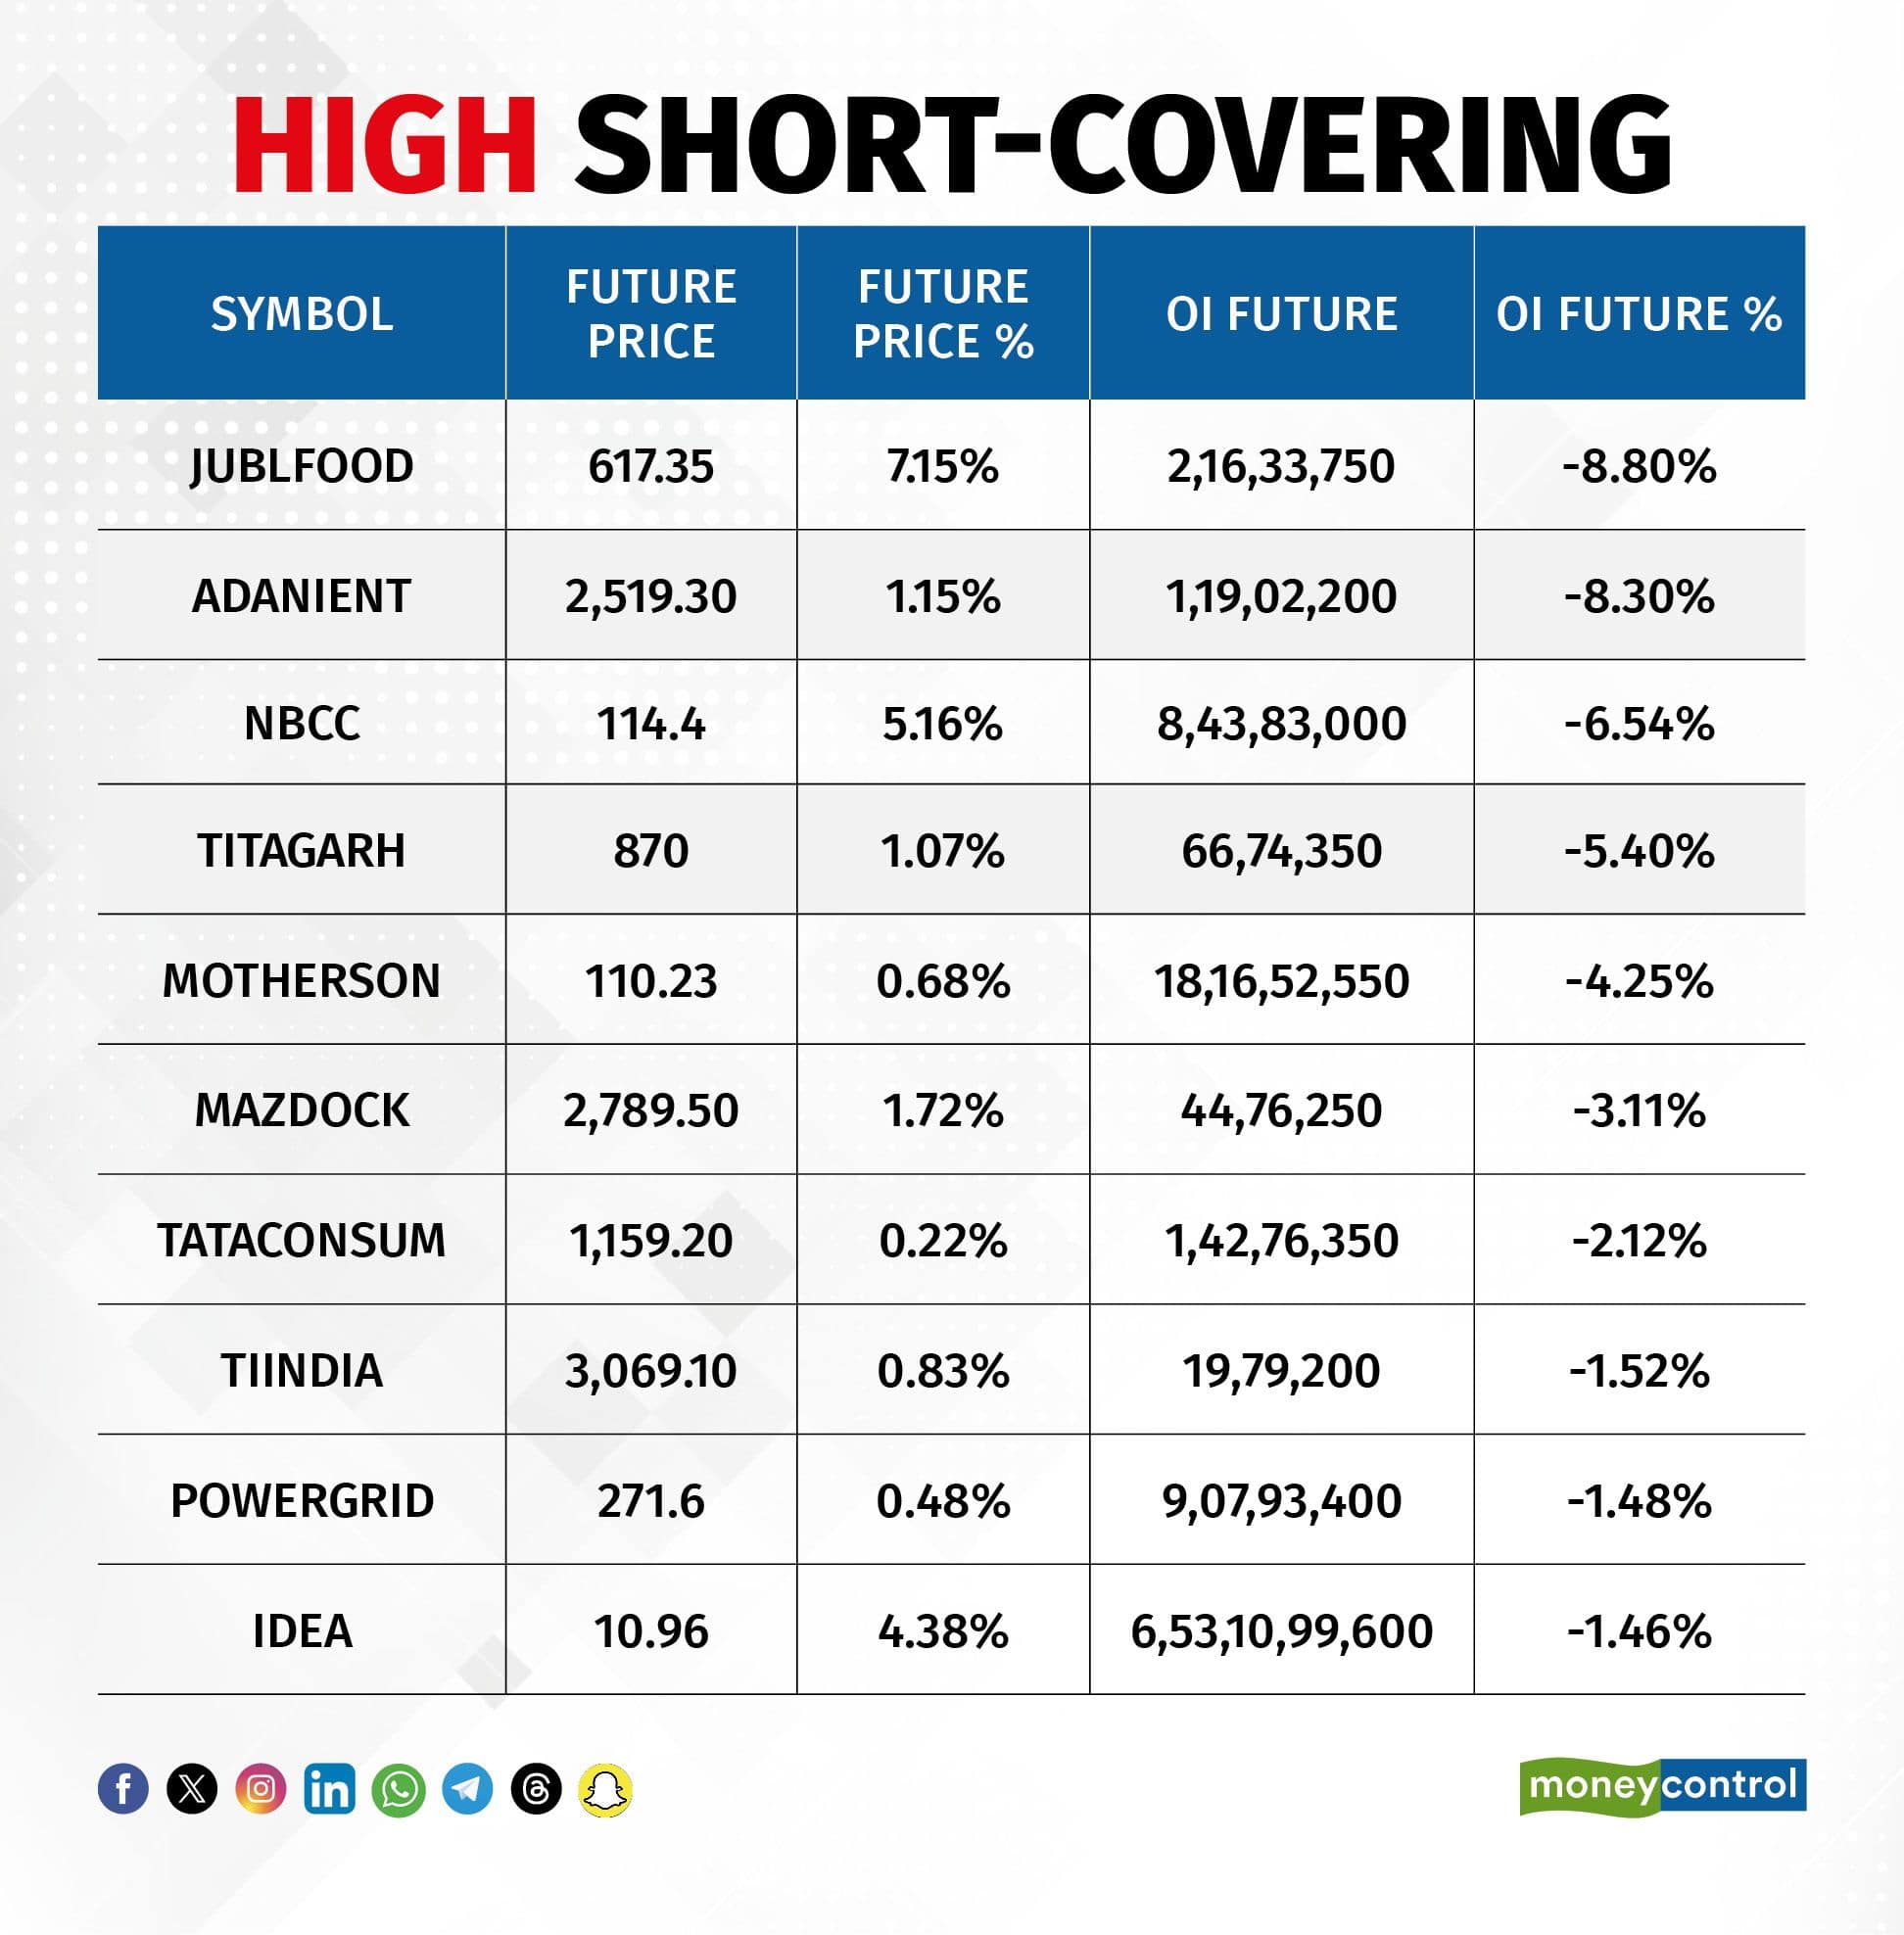
13) Short-Covering (41 Stocks)
41 stocks saw short-covering, meaning a decrease in OI, along with a price increase.
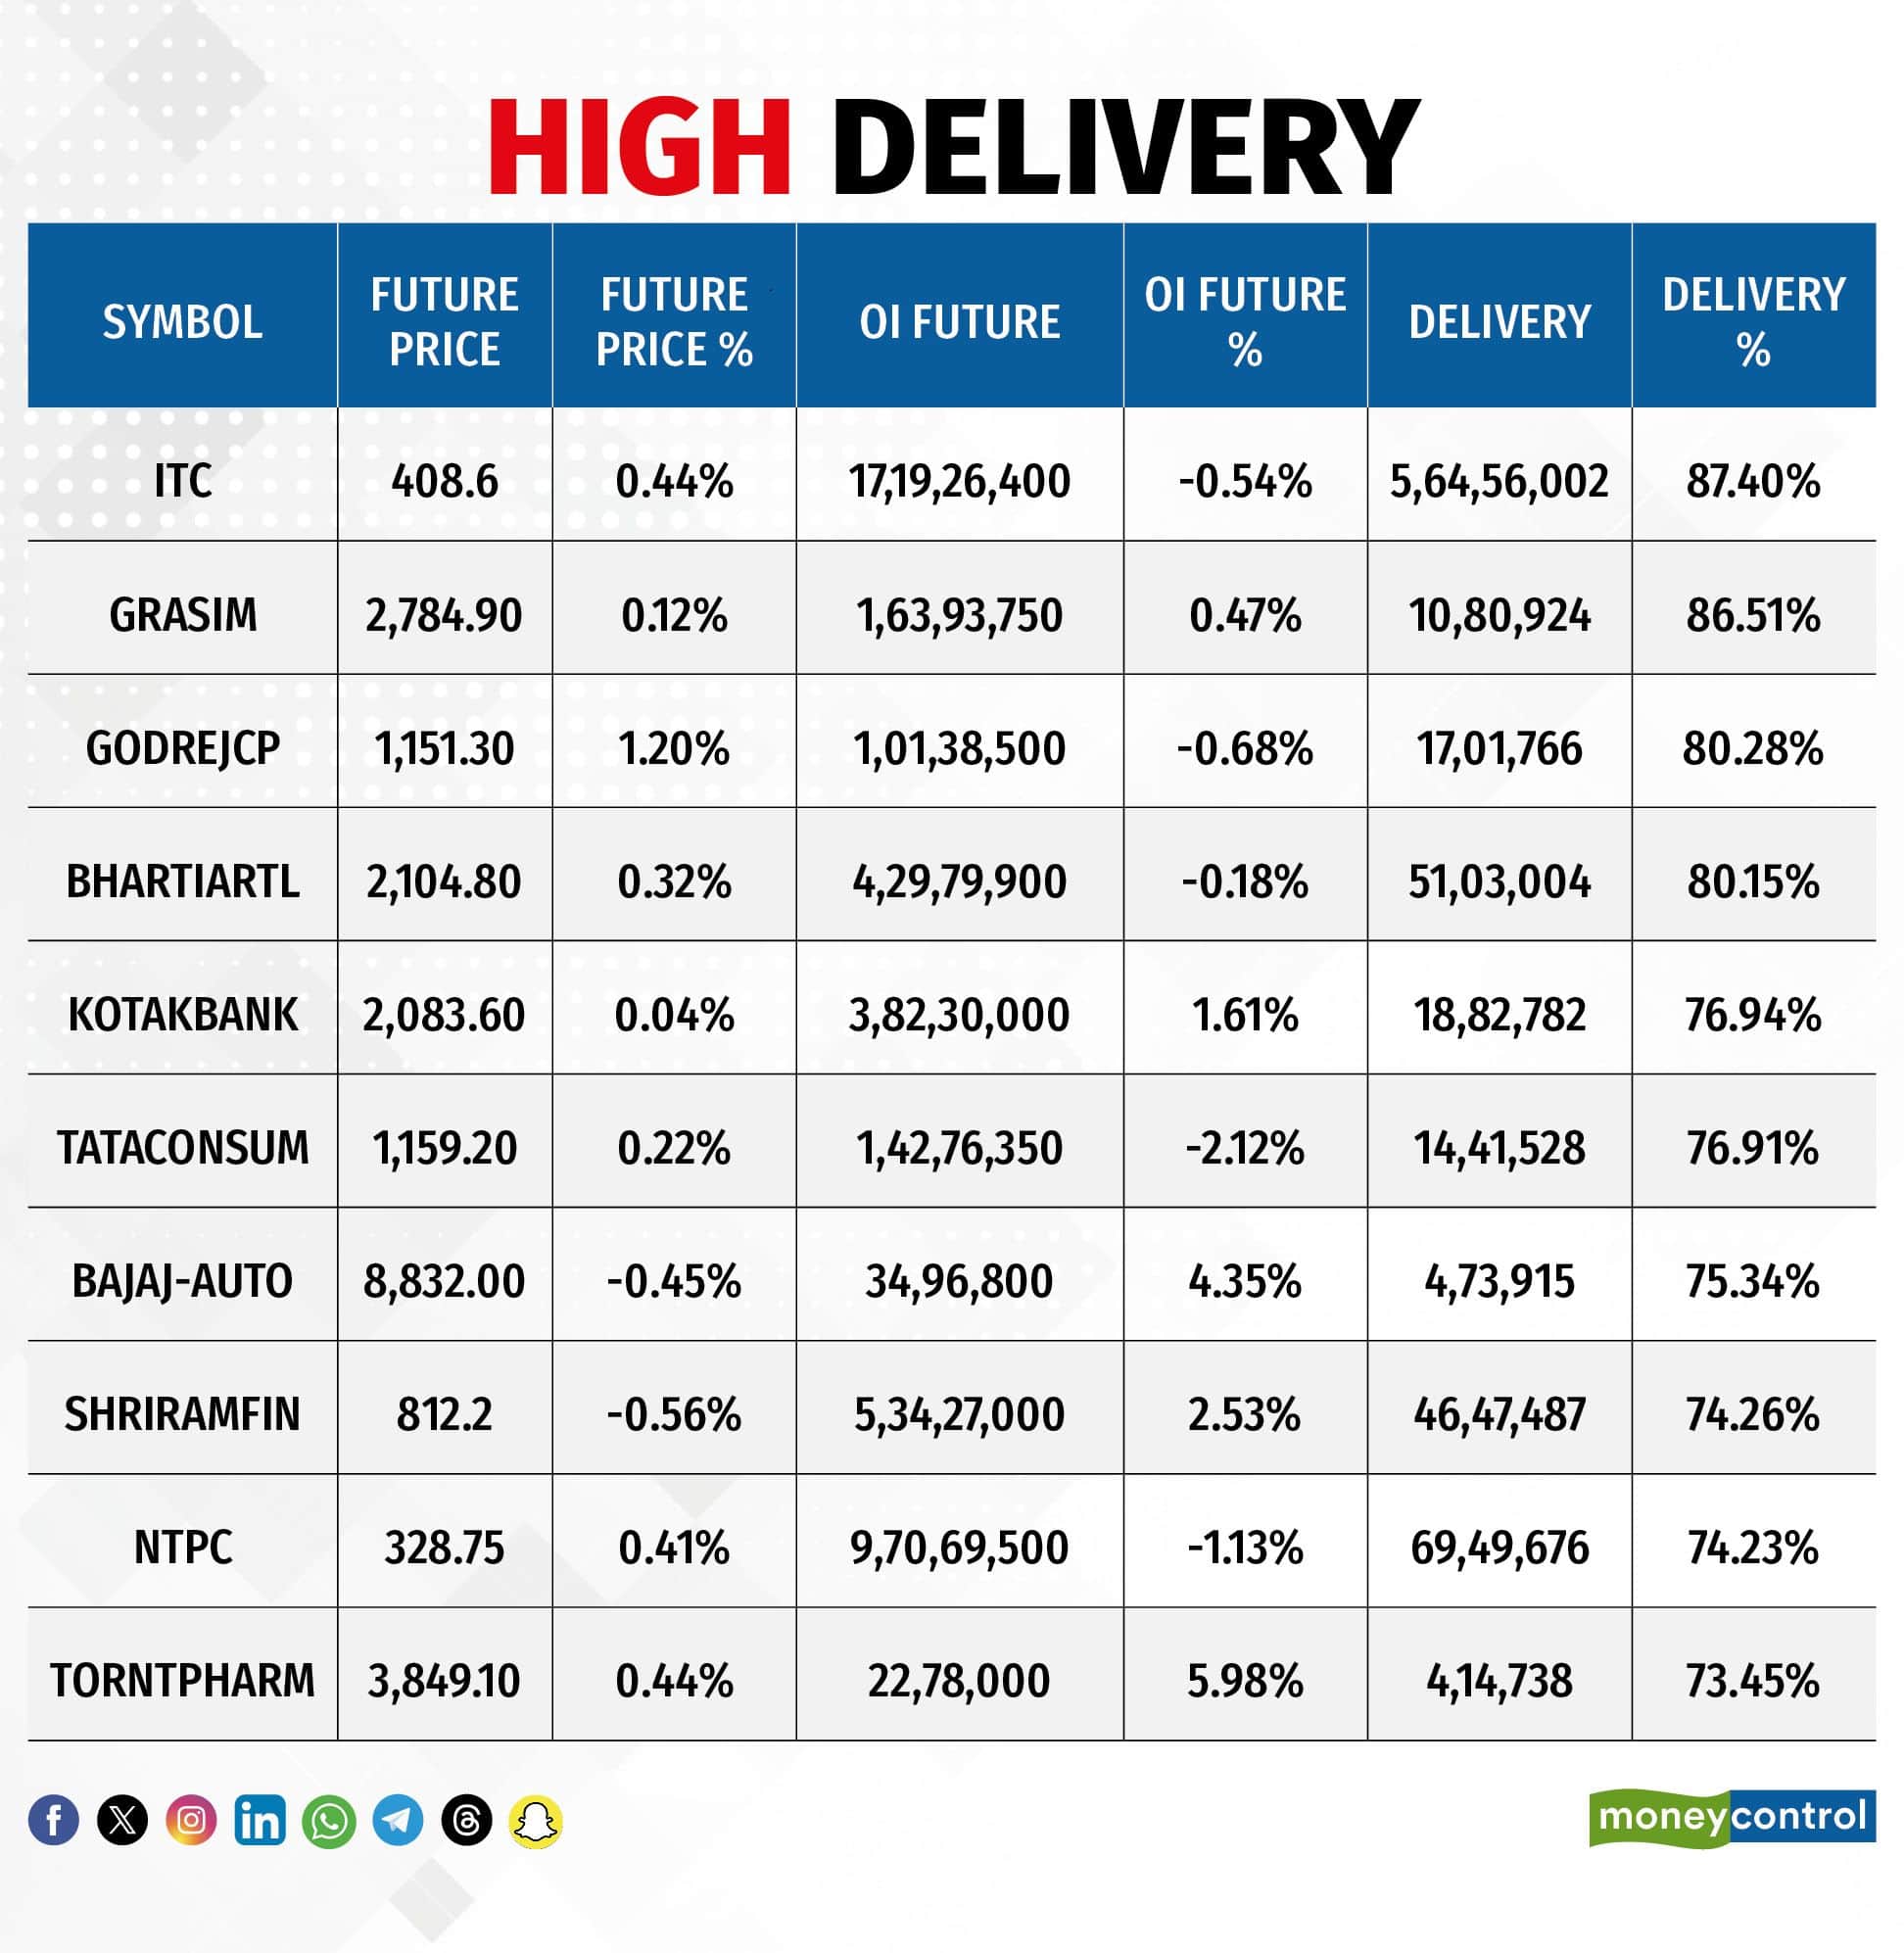
Here are the stocks that saw a high share of delivery trades. A high share of delivery reflects investing (as opposed to trading) interest in a stock.
Securities banned under the F&O segment include companies where derivative contracts cross 95 percent of the market-wide position limit.
Stocks added to F&O ban: Nil
Stocks retained in F&O ban: SAIL
Stocks removed from F&O ban: Nil
Disclaimer: The views and investment tips expressed by experts on Moneycontrol are their own and not those of the website or its management. Moneycontrol advises users to check with certified experts before taking any investment decisions.Disclaimer: Moneycontrol is a part of the Network18 group. Network18 is controlled by Independent Media Trust, of which Reliance Industries is the sole beneficiary.Discover the latest Business News, Sensex, and Nifty updates. Obtain Personal Finance insights, tax queries, and expert opinions on Moneycontrol or download the Moneycontrol App to stay updated!
Find the best of Al News in one place, specially curated for you every weekend.
Stay on top of the latest tech trends and biggest startup news.


