


The market participants were nervous last week and the indices consolidated through the week ended April 13 with Nifty, Sensex falling nearly 2 percent each. On Wednesday, the last day of truncated week, the Nifty50 lost 55 points to close below 17,500 mark, while the BSE Sensex corrected more than 200 points to settle at 58,339.
The market was dragged down on Wednesday by banks, financial services, auto and select IT stocks.
But the broader markets outperformed frontline indices and the market breadth was also in favour of bulls. The Nifty Midcap 100 index was flat with negative bias, and the Smallcap 100 index gained 0.2 percent, while about 1,102 equity shares advanced against 822 declining shares on the NSE.
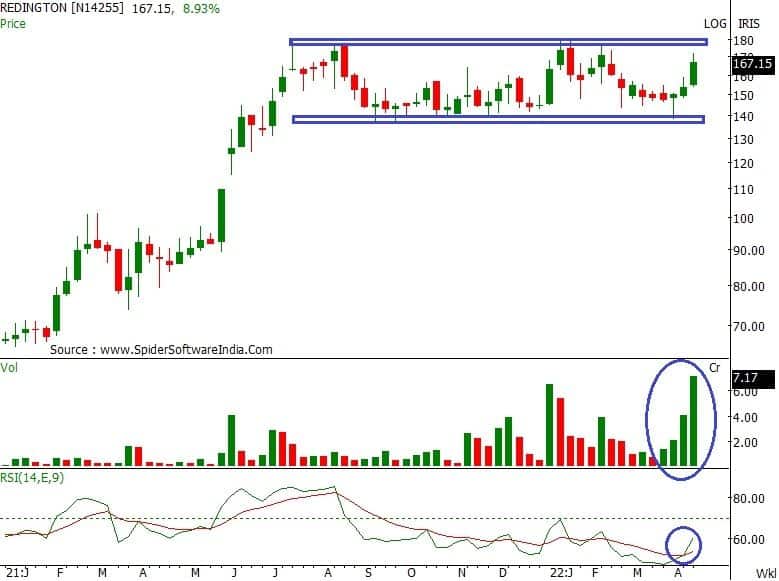
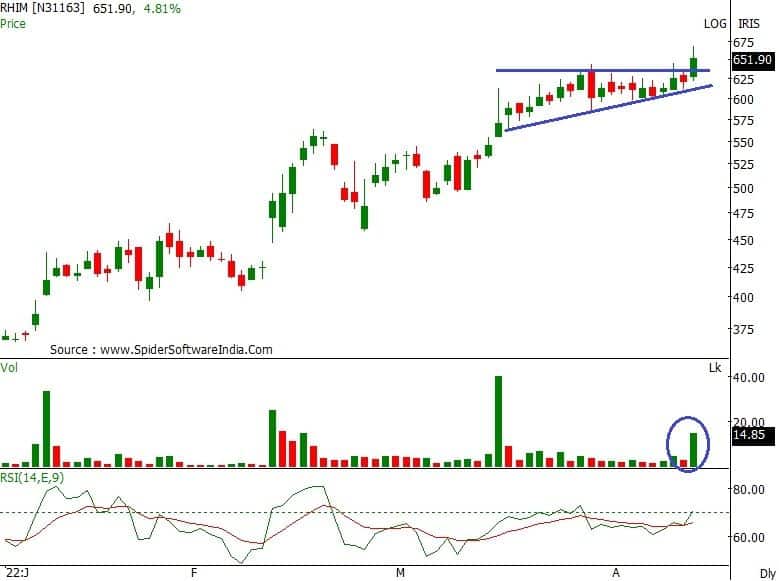
Stocks that were in action on Wednesday include Redington India which rallied 5.4 percent to Rs 166.75; and RHI Magnesita India which ended at record closing high of Rs 649.7, up 4.5 percent.
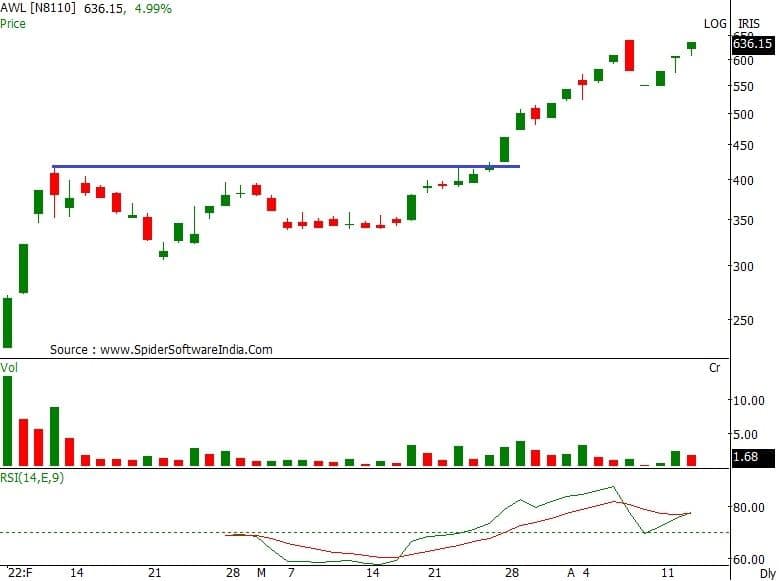
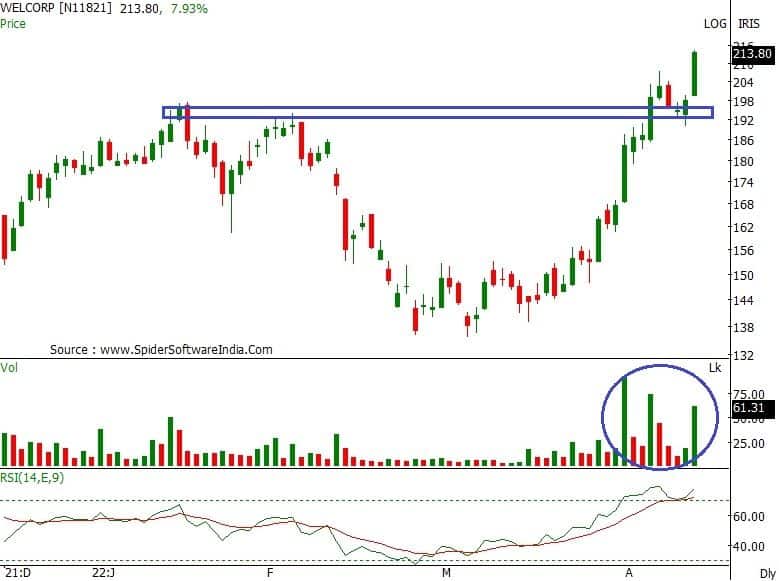
Among others, Adani Wilmar which was locked in 5 percent upper circuit to end at new closing high of Rs 636.15, while Welspun Corp hit fresh 52-week high before closing with 6.87 percent gains at Rs 211.70.
Here's what Rajesh Palviya of Axis Securities recommends investors should do with these stocks when the market resumes trading today:Redington IndiaSince July 2021, the stock continued to consolidate within Rs 180-135 levels, representing a sideways trend. Currently the stock has recaptured its 20, 50, 100 and 200 day SMA (simple moving average) and rebounded sharply.
With last week's high of Rs 172, the stock is approaching its major breakout zone of Rs 175-180 levels, hence any weekly close above the same may confirm continuation of prior up trend. This recent up move is accompanied with huge volumes indicating increased participation. The daily band Bollinger-buy signal indicates rising momentum.
The daily weekly and monthly RSI (relative strength index) continued to remain in bullish mode along with positive crossover which supports sustained strength.
Investors should buy, hold and accumulate this stock with an expected upside of Rs 185-210, with downside support zone of Rs 150-140 levels.
The stock is in huge up-trend across all the time frames forming a series of higher tops and bottom formation indicating sustained uptrend. Every up-move is accompanied with huge and rising volumes which signals increased participation in a rally.
The stock is well placed above its 20, 50, 100 and 200 day SMA which reconfirm bullish sentiments. With current week's high (Rs 668) it has registered an all-time high indicating positive bias.
The daily weekly and monthly RSI continue to remain in bullish mode along with positive crossover which supports sustained strength.
Investors should buy, hold and accumulate this stock with an expected upside of Rs 680-730, with downside support zone of Rs 620-590 levels.
The stock is in strong up-trend across all the time frames forming a series of higher tops and bottom formations indicating sustained strength. Every up-move is accompanied with huge and rising volumes which signals increased participation in a rally.
The daily RSI continues to remain in bullish mode along with positive crossover which supports sustained strength.
Investors should buy, hold and accumulate this stock with an expected upside of Rs 700-750, with downside support zone of Rs 550 levels.
On the daily timeframe, the stock has confirmed "rounding bottom" formation indicating continuation of prior up trend. This breakout is accompanied with huge volumes. On the daily and weekly time frame, the stock is in an up trend forming a series of higher tops and bottoms indicating bullish trend.
The stock is well placed above its 20, 50, 100 and 200 day SMA which reconfirm bullish trend. The weekly band bollinger - buy signal indicates rising momentum.
Investors should buy, hold and accumulate this stock with an expected upside of Rs 230-250, with downside support zone of Rs 195-190 levels.
Discover the latest Business News, Sensex, and Nifty updates. Obtain Personal Finance insights, tax queries, and expert opinions on Moneycontrol or download the Moneycontrol App to stay updated!
Find the best of Al News in one place, specially curated for you every weekend.
Stay on top of the latest tech trends and biggest startup news.


