


Equity benchmarks erased significant gains in the second half of the session and closed with modest gains, with the Nifty 50 holding the 25,000 mark on June 24. Market breadth turned favourable for the bulls, with a total of 1,800 shares witnessing buying interest compared to 807 declining shares on the NSE. The market is expected to maintain an upward trend amid consolidation. Below are some short-term trading ideas to consider:
Amol Athawale, VP-Technical Research at Kotak Securities
Oberoi Realty | CMP: Rs 1,988
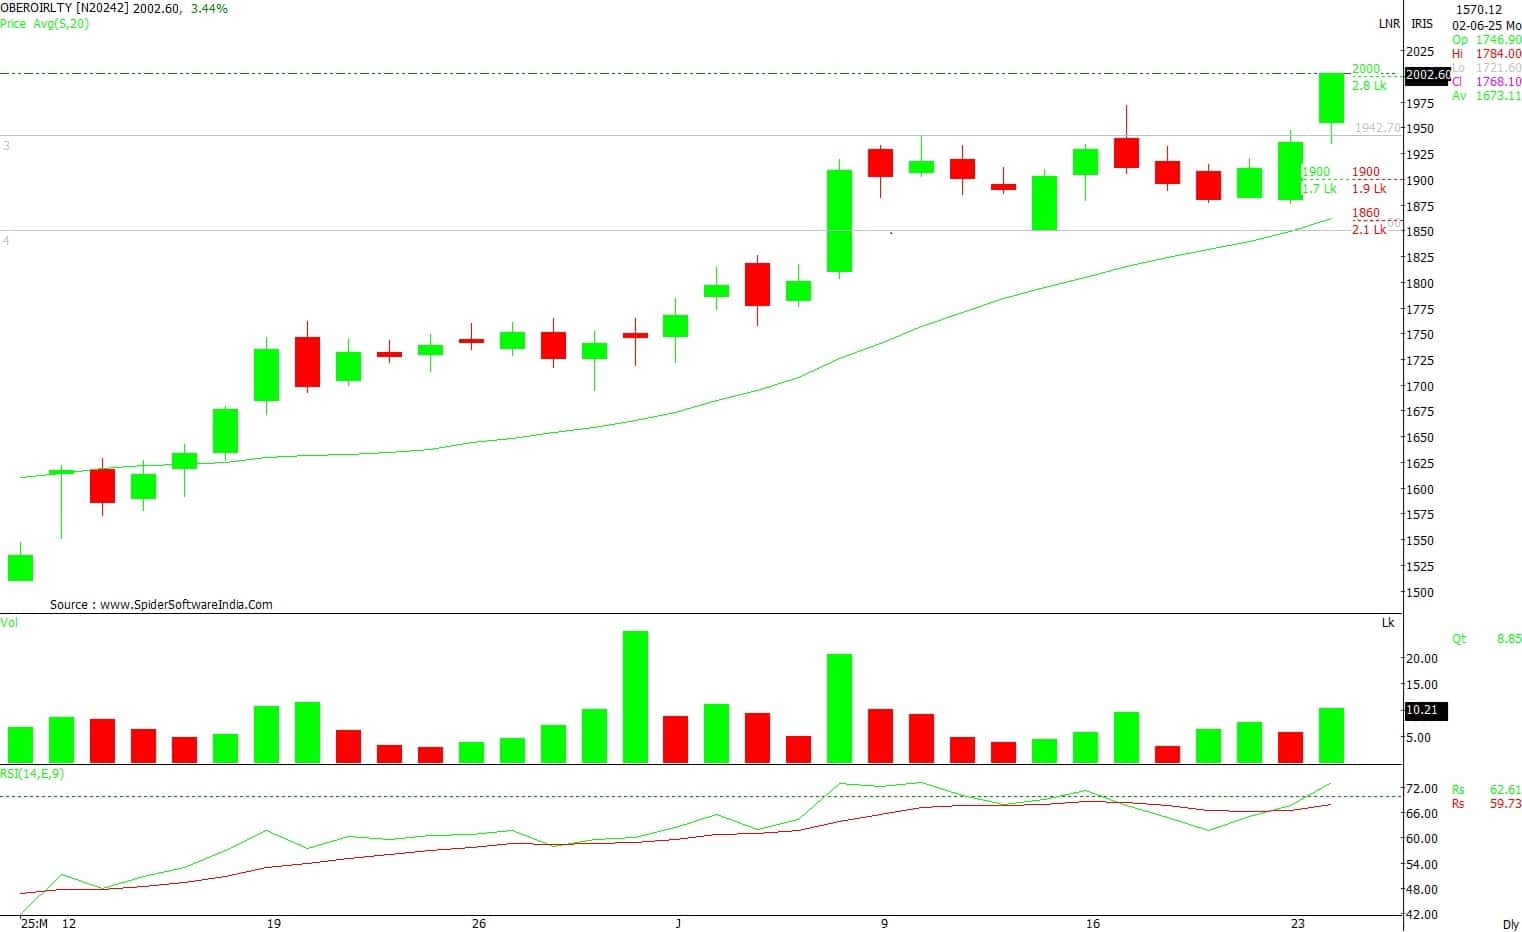
After the remarkable up move over the last few weeks, Oberoi Realty witnessed consolidation near the resistance zone. However, following the consolidation, the stock comfortably closed above its breakout zone. This closing above the resistance zone on the daily chart suggests a bullish continuation structure, and the up move is likely to persist in the coming sessions. For the next few trading sessions, Rs 1,930 could be the trend-deciding level for the bulls. If it sustains above this level, we can expect a further uptrend towards Rs 2,140.
Strategy: Buy
Target: Rs 2,140
Stop-Loss: Rs 1,930
Canara Bank | CMP: Rs 110.61
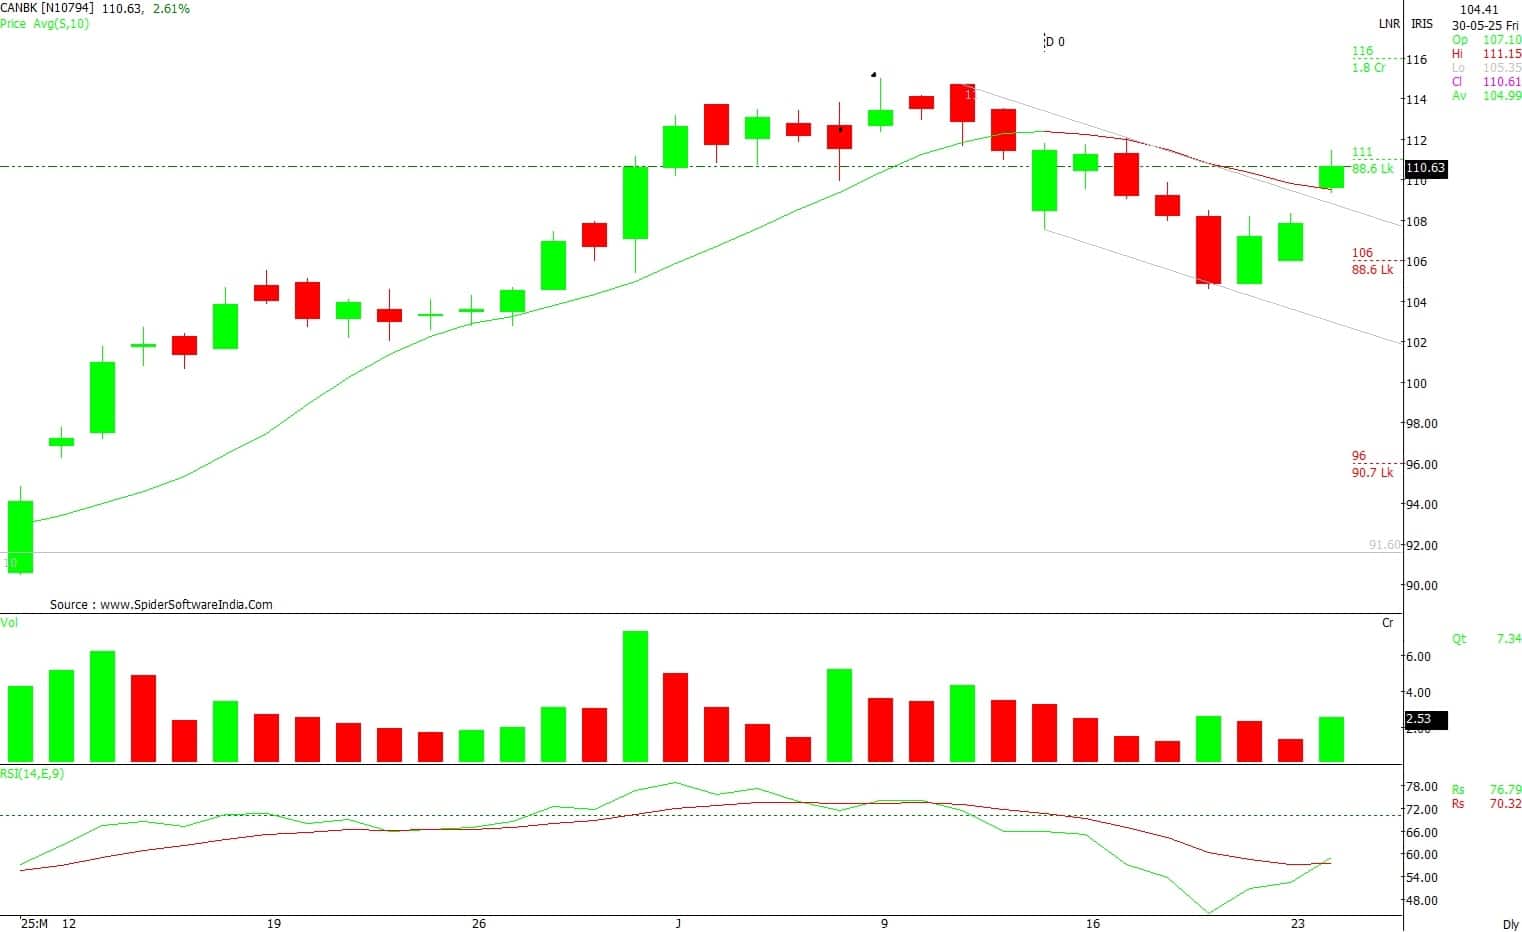
After declining from higher levels, Canara Bank rebounded from its support zone and has shown a steady recovery. Additionally, on the daily charts, the stock has given a breakout from its sloping channel formation. The recent up moves suggest a new leg of a bullish trend is forming from current levels. As long as the stock trades above Rs 106, the uptrend is likely to continue, with potential upside towards Rs 118. A fresh sell-off is possible only if it falls below Rs 106.
Strategy: Buy
Target: Rs 118
Stop-Loss: Rs 106
Bharat Heavy Electricals | CMP: Rs 260
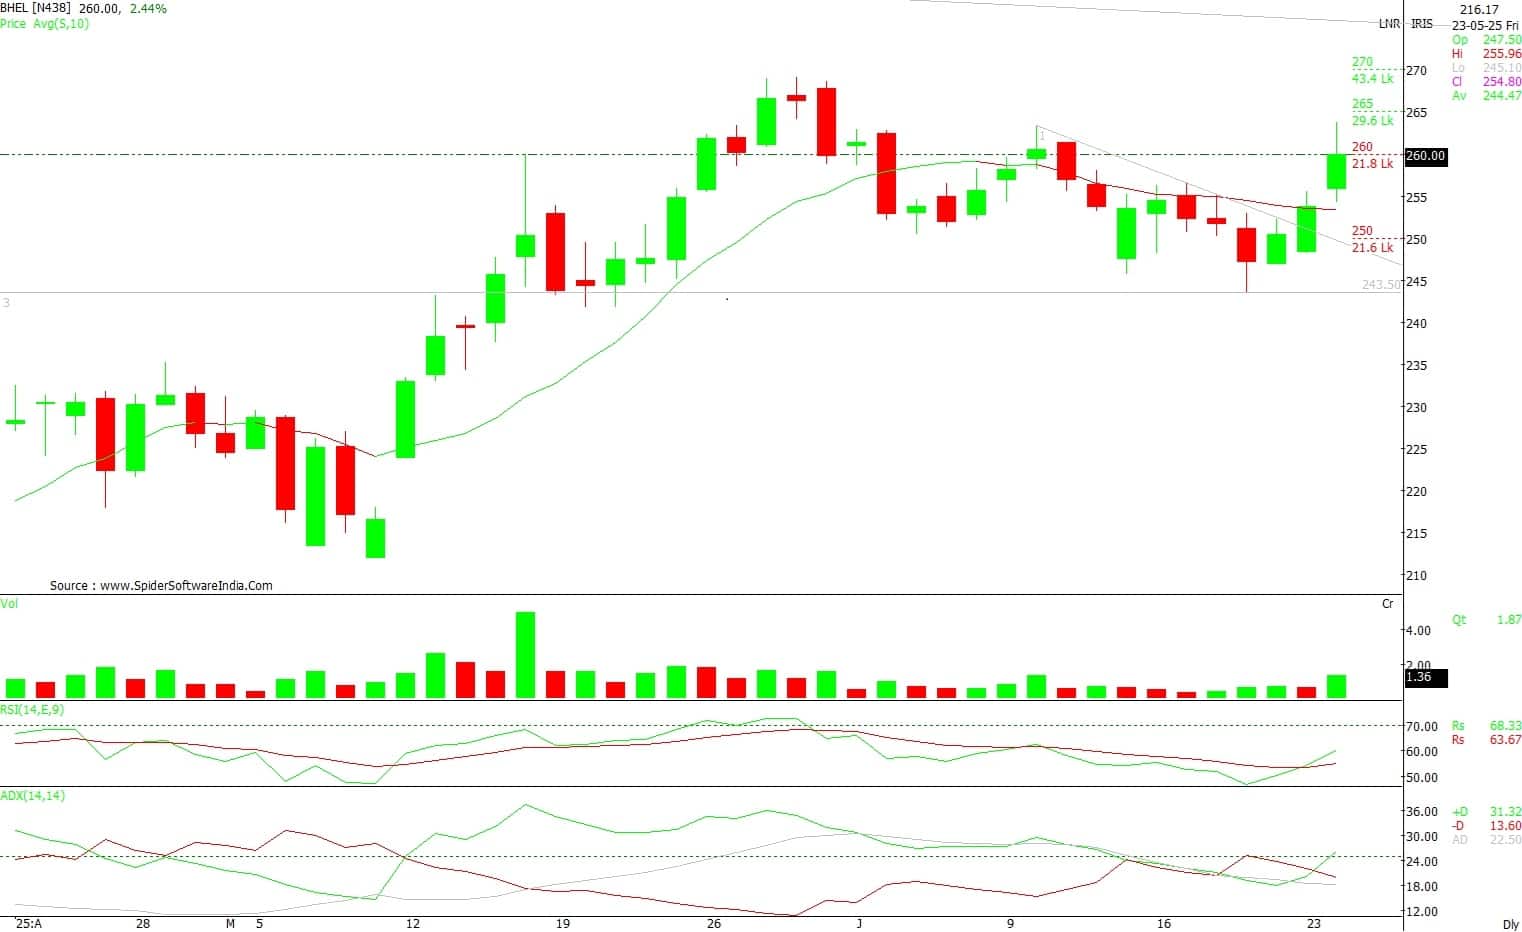
On the daily chart, after an impressive up move, BHEL experienced a gradual decline. However, it has now given a breakout from its sloping trendline with rising volume activity. The stock is showing a bullish continuation chart structure, indicating that a new leg of the up move is likely to resume. For positional traders, Rs 250 is the decisive level. Trading above this level, the uptrend may continue towards Rs 280. However, if it closes below Rs 250, traders may prefer to exit long positions.
Strategy: Buy
Target: Rs 280
Stop-Loss: Rs 250
Ashish Kyal, CMT, Founder and CEO of Waves Strategy Advisors
Delhivery | CMP: Rs 377
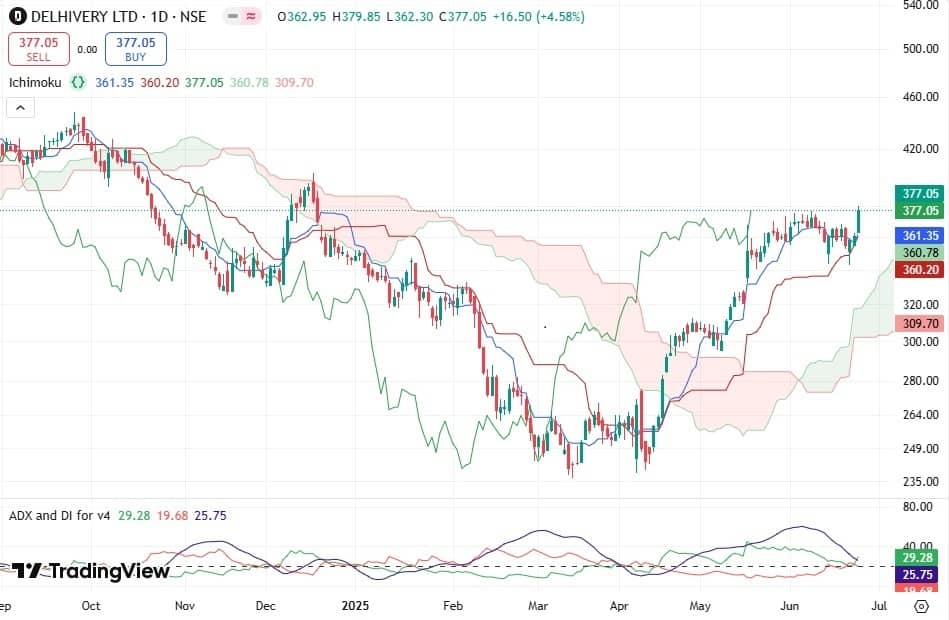
In the previous session, Delhivery finally closed above its previous swing high of Rs 377 and surged 4.6%, which is a strong bullish sign. Since the breakout of the Ichimoku Cloud in May 2025, the baseline (red line) of the indicator has acted as classic support. Last week, prices found support at this line and reversed to the upside, reinforcing the positive outlook. Additionally, the ADX (Average Directional Index) is above 25, suggesting that bullish momentum is building. A break above Rs 380 is crucial for the trend to continue towards Rs 395 and Rs 410.
Strategy: Buy
Target: Rs 395, Rs 410
Stop-Loss: Rs 364
Kajaria Ceramics | CMP: Rs 1,105.3
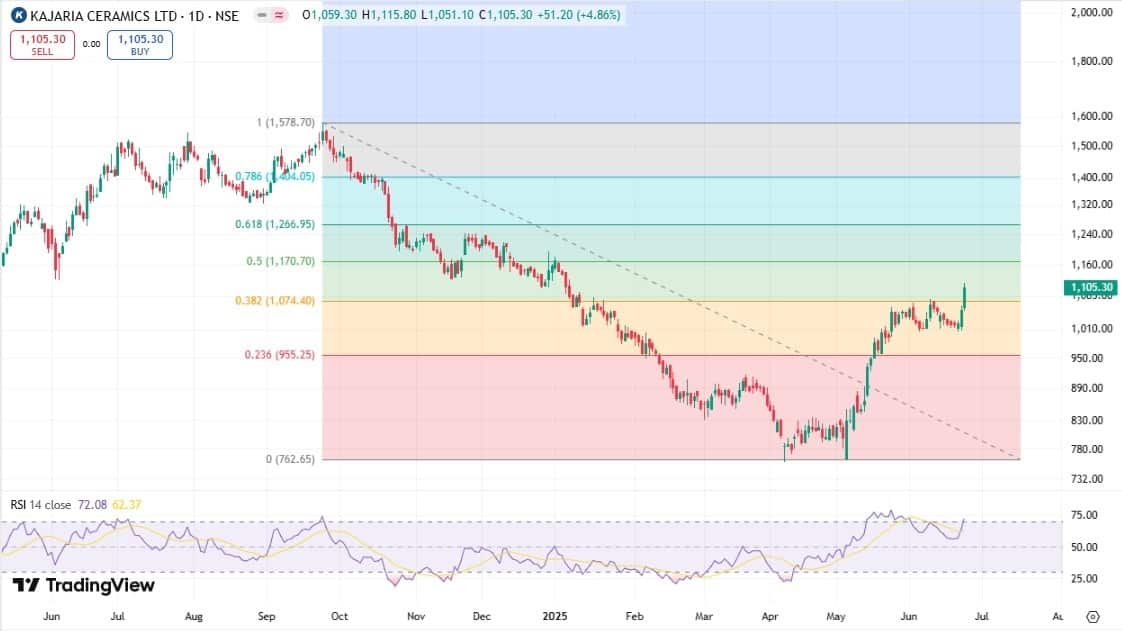
On the daily chart, Kajaria Ceramics had been forming a classic rounding bottom pattern since January 2025. In the recent sessions, the stock gave a breakout by closing above the neckline at Rs 1,082. Prices have now retraced more than 38.2% of the previous fall that began in September 2024. With continued buying interest, a 50% retracement is expected, which is near Rs 1,171. The current trend remains positive. Use dips towards Rs 1,076 as a buying opportunity for targets of Rs 1,171 or higher.
Strategy: Buy
Target: Rs 1,171
Stop-Loss: Rs 1,048
Indus Towers | CMP: Rs 415
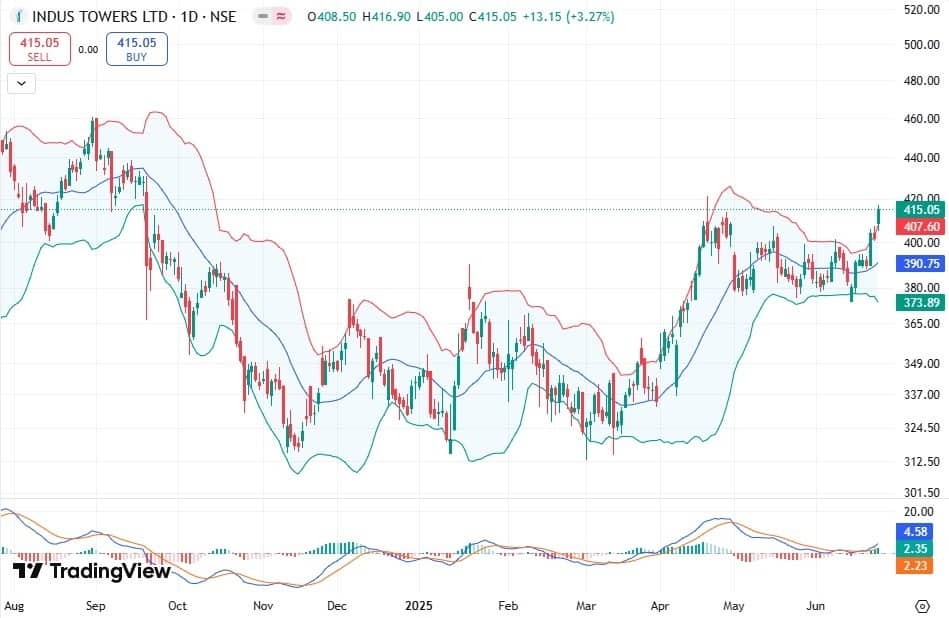
Since June 16, Indus Towers has consistently protected its prior day’s low on a closing basis, keeping the daily trend bullish. In the previous session, the stock closed above the upper Bollinger Band, and the bands have started expanding, indicating an impending trending move. Furthermore, the MACD has recently shown a bullish crossover, providing additional confirmation. A break and acceptance above Rs 422, the previous swing high, could lift the price to Rs 440, followed by Rs 460.
Strategy: Buy
Target: Rs 440, Rs 460
Stop-Loss: Rs 404
Vinay Rajani, CMT, Senior Technical and Derivative Analyst at HDFC Securities
JSW Infrastructure | CMP: Rs 308

JSW Infrastructure has broken out of a symmetrical triangle pattern on the weekly chart, accompanied by a spike in volume. The stock is trading above both the 50-day and 200-day EMAs. The weekly RSI is above 50, indicating a sustainable uptrend. The weekly MACD is positioned above both the signal line and the equilibrium line.
Strategy: Buy
Target: Rs 350
Stop-Loss: Rs 279
Swiggy | CMP: Rs 391.15
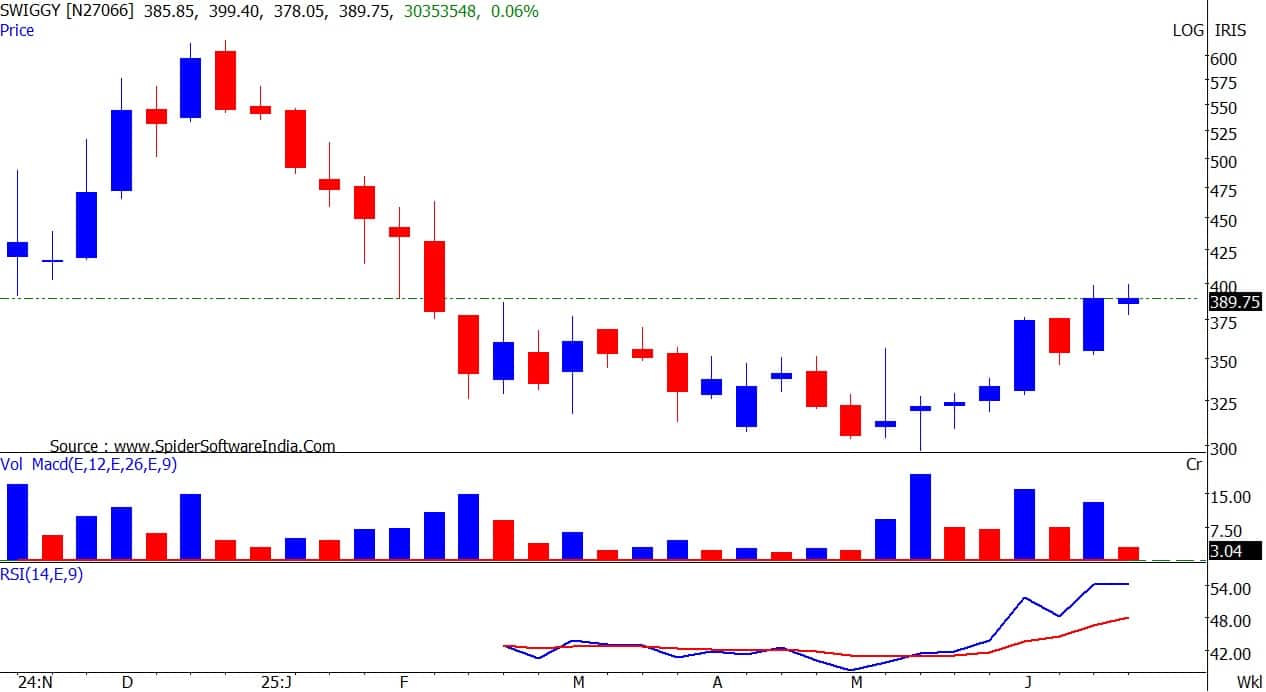
Swiggy has surpassed the crucial resistance of the 20-day EMA with strong volume support. The daily RSI is holding above 50, indicating strength in the stock. The daily MACD has shown a positive crossover both on the signal line and the equilibrium line. The stock has started forming a higher high–higher low pattern on the daily chart and has taken out its previous swing high resistance.
Strategy: Buy
Target: Rs 445
Stop-Loss: Rs 364
Lodha Developers | CMP: Rs 1,470.5
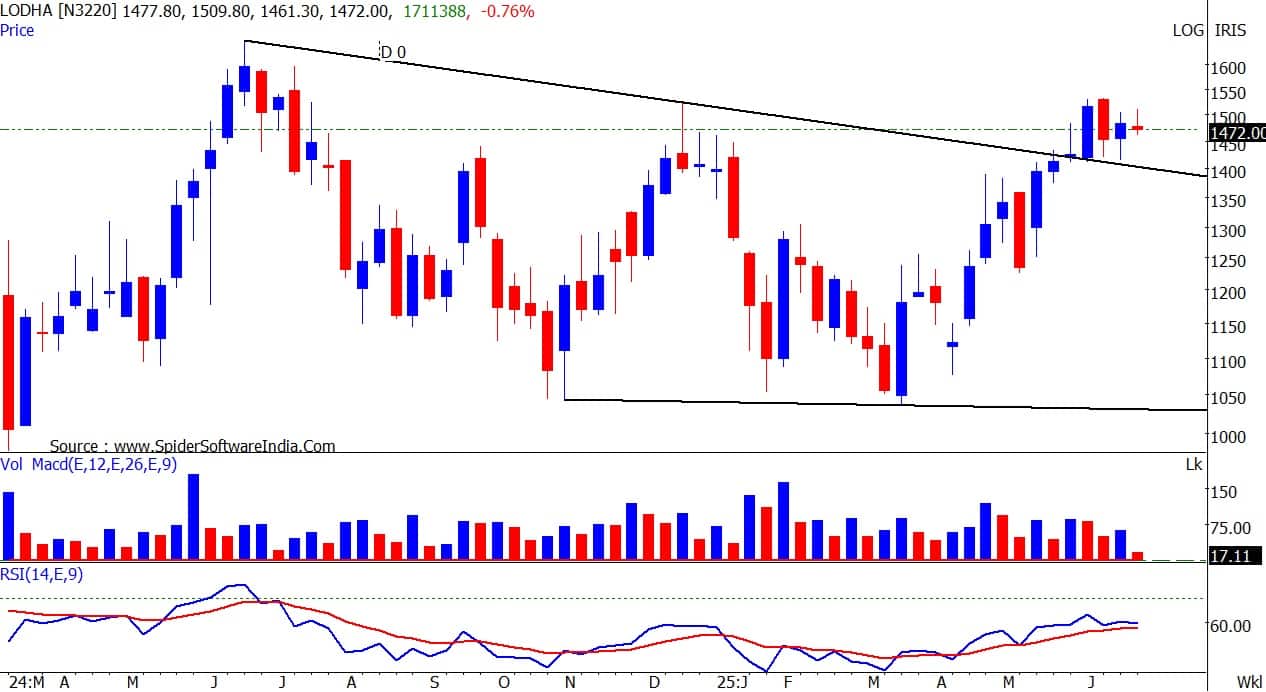
Lodha Developers has broken out from a descending triangle pattern on the weekly chart. The stock is trading above key moving averages, indicating a bullish trend across all time frames. The realty sector index has been outperforming in recent weeks. The monthly RSI has given a bullish crossover, suggesting strength in the stock. Volumes have increased alongside the recent price rise. The stock is also forming higher highs and higher lows on the daily chart.
Strategy: Buy
Target: Rs 1,680
Stop-Loss: Rs 1,300
Disclaimer: The views and investment tips expressed by investment experts on Moneycontrol.com are their own and not those of the website or its management. Moneycontrol.com advises users to check with certified experts before taking any investment decisions.
Discover the latest Business News, Sensex, and Nifty updates. Obtain Personal Finance insights, tax queries, and expert opinions on Moneycontrol or download the Moneycontrol App to stay updated!
Find the best of Al News in one place, specially curated for you every weekend.
Stay on top of the latest tech trends and biggest startup news.


