


The benchmark indices finished the range-bound session on a weak note on December 12, with the market breadth favouring bears. About 1,747 shares declined compared to 756 shares that advanced on the NSE. The market may extend the downtrend if it breaks the 10-day EMA (Exponential Moving Average) amid likely consolidation, while the VIX in the lower zone supports bulls. Below are some trading ideas for the near term:
Amol Athawale, VP-Technical Research at Kotak Securities
Tech Mahindra | CMP: Rs 1,789.6

After the remarkable uptrend of the last couple of weeks, Tech Mahindra witnessed profit booking from the higher levels. However, closing near an important support zone and the short-term moving average suggest a bullish continuation chart structure. Therefore, the stock is likely to resume its uptrend in the coming period.
Strategy: Buy
Target: Rs 1,910
Stop-Loss: Rs 1,720
AU Small Finance Bank | CMP: Rs 591

AU Small Finance Bank is in the accumulation zone, trading in a rangebound mode for the past few weeks. The texture of the chart formation and the technical indicator RSI (Relative Strength Index) suggest that the stock is very likely to break out from the rectangle formation for a new leg of the uptrend in the near term.
Strategy: Buy
Target: Rs 630
Stop-Loss: Rs 565
JSW Steel | CMP: Rs 1,005.8

After a remarkable up move, JSW Steel is trading in a symmetrical triangle chart formation on the weekly scale, which clearly suggests that bullish momentum is likely to remain in the short term. Additionally, the stock has formed a higher bottom formation, indicating good strength in the counter for a fresh breakout from the current levels.
Strategy: Buy
Target: Rs 1,070
Stop-Loss: Rs 965
Chandan Taparia, Head Derivatives & Technicals, Wealth Management at Motilal Oswal Financial Services
LTIMindtree | CMP: Rs 6,667.65

LTIMindtree has given a trendline breakout on the daily chart and reached the highest daily close ever. Buying is visible across IT stocks, which may support the ongoing uptrend. The strength indicator ADX (Average Directional Index) is headed upward, confirming the uptrend.
Strategy: Buy
Target: Rs 7,000
Stop-Loss: Rs 6,466
Max Healthcare Institute | CMP: Rs 1,167.7
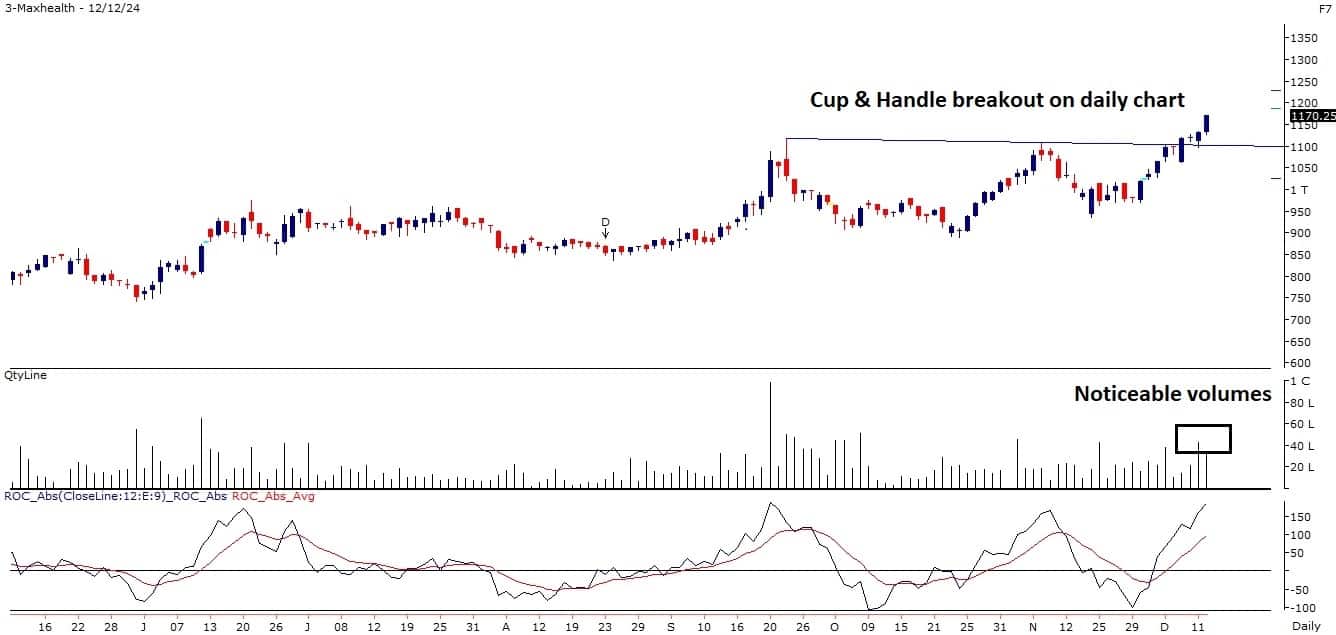
Max Healthcare Institute has given a Cup & Handle breakout on the daily chart and managed to close above the same. It has formed a strong bullish candle on the daily scale, and the base is shifting higher. The ROC (Rate of Change) indicator is positively placed.
Strategy: Buy
Target: Rs 1,220
Stop-Loss: Rs 1,140.
Muthoot Finance | CMP: Rs 2,127.35

Muthoot Finance has given a range breakout on the daily chart. It has been continuously forming higher highs and higher lows for the past four trading sessions. The MACD (Moving Average Convergence Divergence) indicator is rising, confirming the bullish momentum.
Strategy: Buy
Target: Rs 2,230
Stop-Loss: Rs 2,060
Mandar Bhojane, Equity Research Analyst at Choice Broking
Tata Teleservices (Maharashtra) | CMP: Rs 85.4
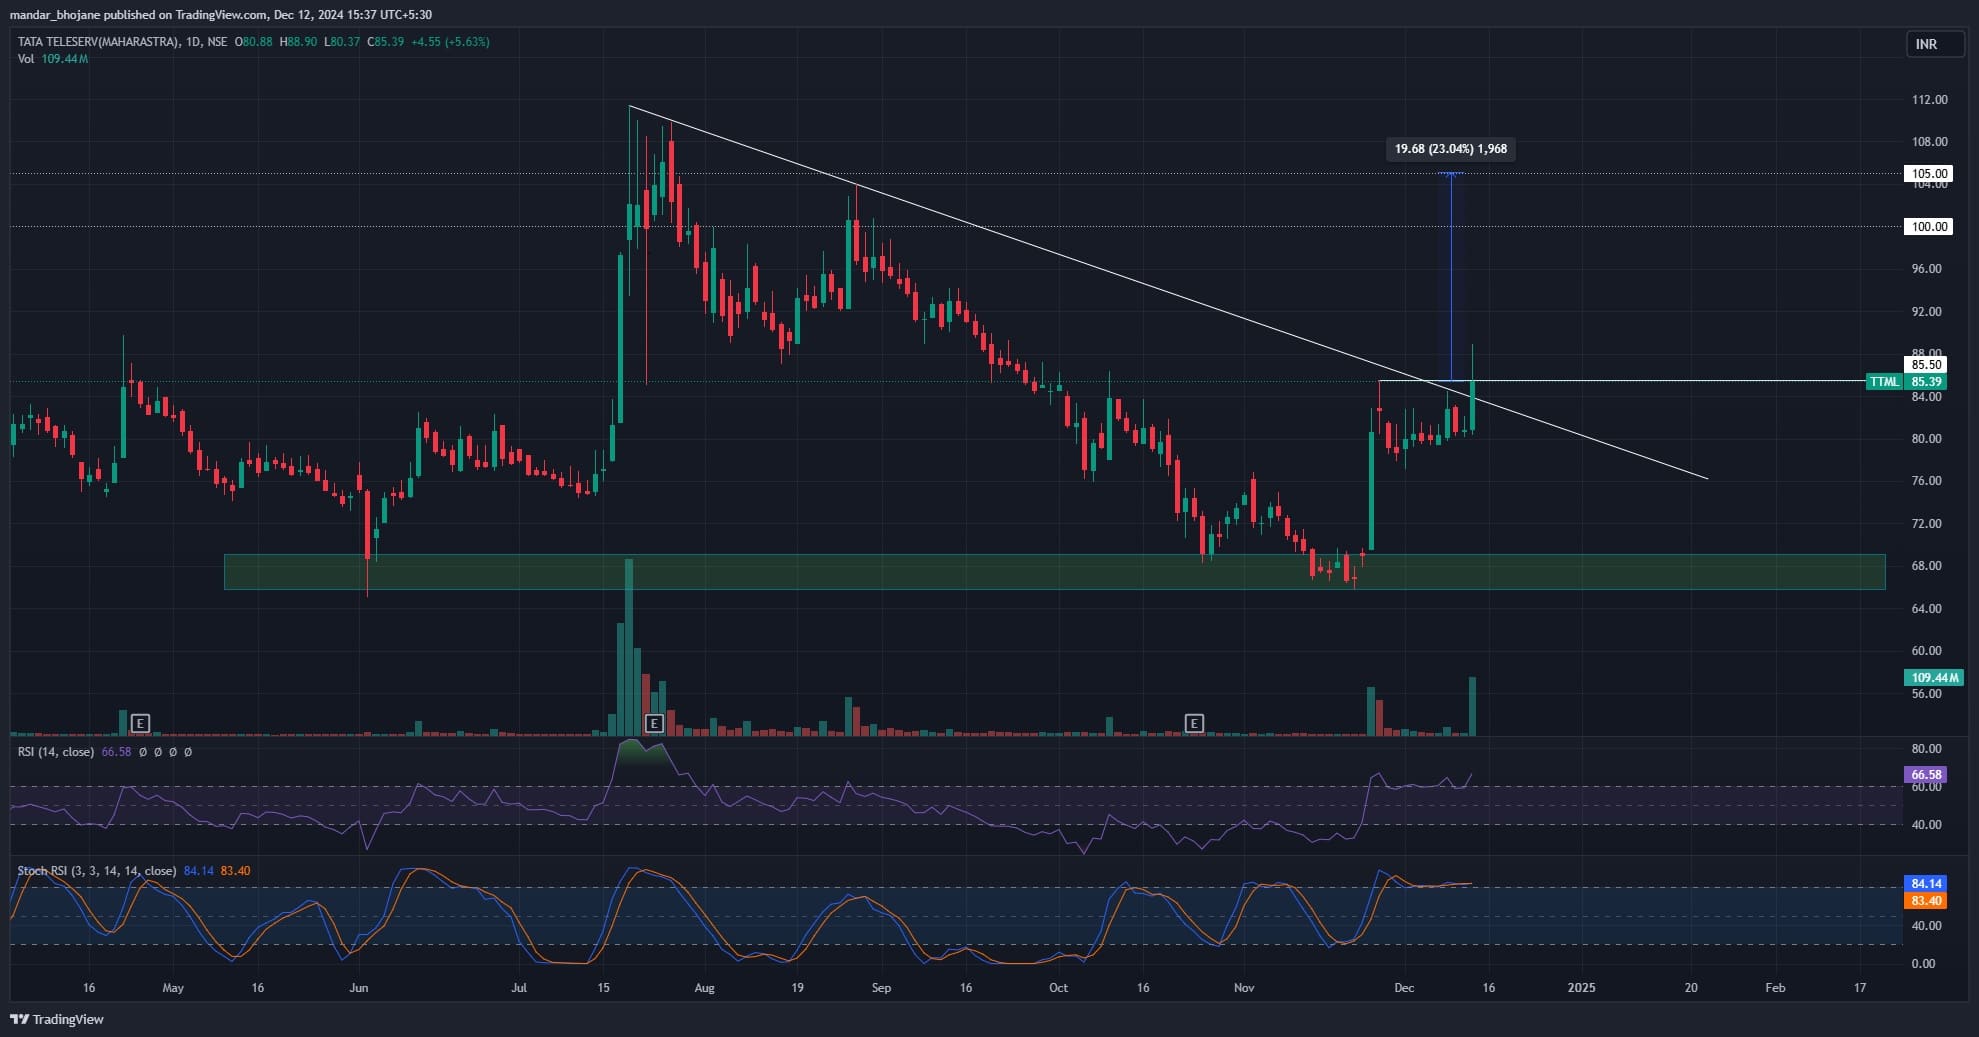
Tata Teleservices has recently broken out from a descending trendline, indicating a potential shift in market sentiment. The price is consolidating just below the breakout level on the daily chart, which suggests strong bullish momentum. This breakout, combined with a notable increase in trading volume, reinforces the case for upward movement.
Furthermore, the RSI is trending upwards at 66, and the Stochastic RSI is showing a positive crossover, both indicating increasing bullish momentum. A decisive close above Rs 85.50 could open the door for short-term targets of Rs 96 and Rs 100. On the downside, immediate support is located at Rs 83, which may present an attractive buying opportunity on dips.
Strategy: Buy
Target: Rs 96, Rs 100
Stop-Loss: Rs 80
Cyient | CMP: Rs 2,089.65

Cyient has recently broken out of a symmetrical triangle pattern on the daily chart. This breakout is supported by a notable increase in trading volume, indicating strong buying interest and the potential for sustained upward momentum. Technical indicators further support the bullish outlook, with the RSI trending upwards at 61.38 and the Stochastic RSI confirming a positive crossover. If the price remains above Rs 2,100, it could pave the way for short-term targets of Rs 2,300 and Rs 2,400. On the downside, immediate support is at Rs 2,000, providing a potential buying opportunity on dips.
Strategy: Buy
Target: Rs 2,300, Rs 2,400
Stop-Loss: Rs 1,940
Jindal Stainless | CMP: Rs 752.65

Jindal Stainless is approaching a breakout from a symmetrical triangle pattern on the daily chart. The stock has been consolidating near its resistance level, suggesting potential accumulation by buyers. The increase in trading volume indicates heightened buying interest, pointing to a possible continuation of bullish momentum. This outlook is further supported by the RSI trending upward at 54.53, a positive crossover in the Stochastic RSI, and the price trading above all major EMAs.
A decisive close above Rs 760 could act as a catalyst for further upward movement, with short-term targets of Rs 870 and Rs 900. On the downside, strong support at Rs 735 offers a favourable entry point for investors looking to buy on dips.
Strategy: Buy
Target: Rs 870, Rs 900
Stop-Loss: Rs 700
Drumil Vithlani, Technical Research Analyst at Bonanza
Aeroflex Industries | CMP: Rs 230.61
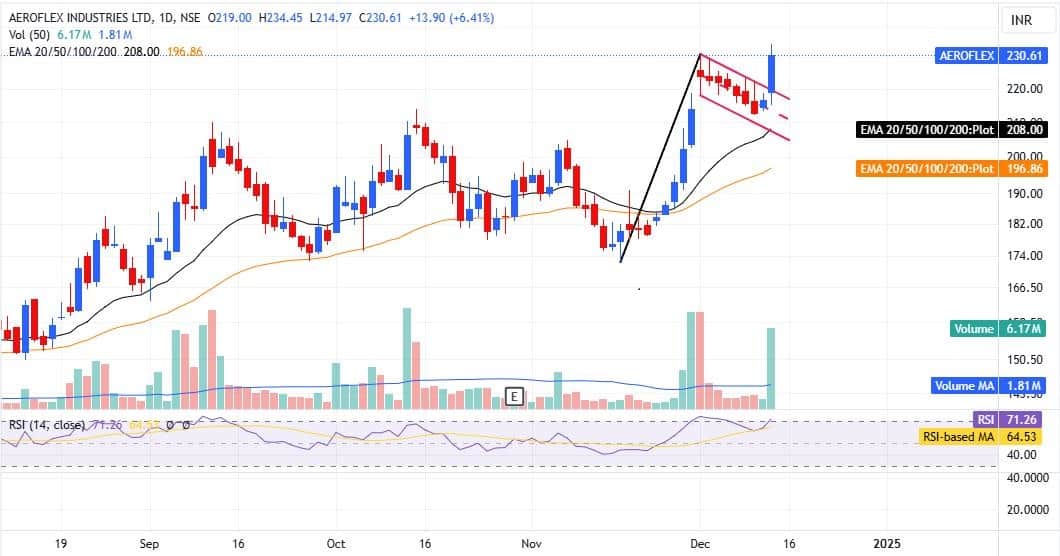
Aeroflex has recently experienced a breakout from a Flag & Pole pattern on the daily chart, indicating a continuation of the uptrend. This pattern is widely recognized as a bullish signal, suggesting a likely increase in the stock's price. The surge in volume during the last trading session reflects heightened buying interest, reinforcing the stock's positive outlook. Additionally, the momentum indicator RSI is positioned above the key moving average (14-period SMA), supporting the price action.
Strategy: Buy
Target: Rs 245
Stop-Loss: Rs 222
BLS International Services | CMP: Rs 477.55
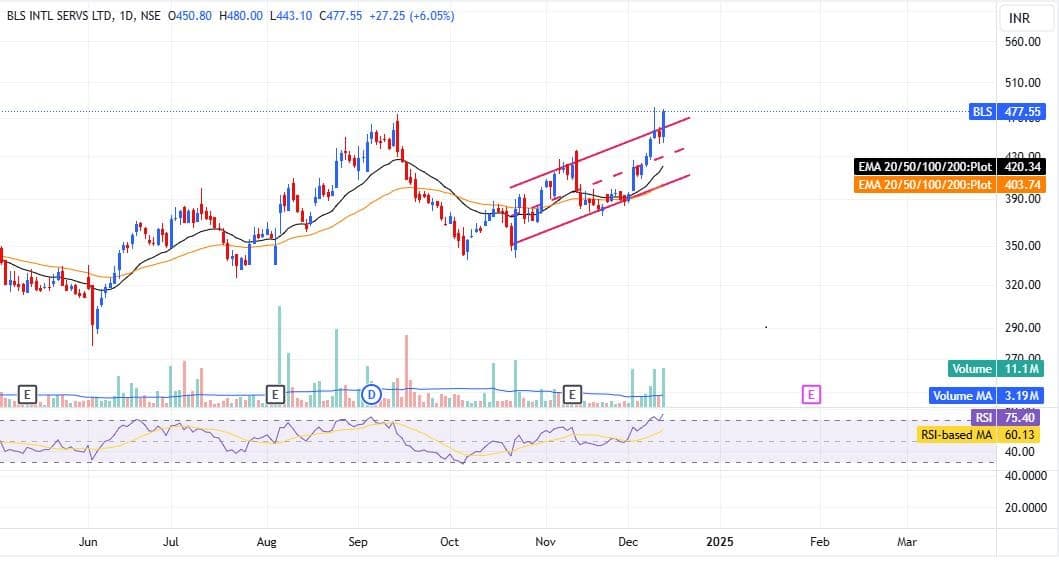
On the daily timeframe, BLS International has experienced a pattern called Rising Channel, signaling a potential continuation of the uptrend. The breakout is confirmed above Rs 464-467 levels, and in the last trading sessions, above-average volume indicates rising investor interest and confidence in the stock. Additionally, the closing above all major EMAs, a classic bullish signal, suggests strengthening upward momentum. The momentum indicator RSI is placed above 60, reflecting strong buying interest, which could drive the stock’s price higher in the near term.
Strategy: Buy
Target: Rs 508
Stop-Loss: Rs 460
GHCL | CMP: Rs 740.75

On the daily chart, GHCL has displayed a strong bullish candle, marking a significant gain of 5.81% in the last session, along with a breakout above a crucial resistance level. This breakout is reinforced by a substantial increase in trading volume, indicating robust buyer dominance. The stock's firm closing near its 52-week highs highlights the prevailing positive sentiment and reinforces the bullish price action.
Furthermore, the price is trading comfortably above key Exponential Moving Averages (EMAs), signaling a sustained upward trend. The upward slope of the slow EMA further validates the continuation of bullish momentum. This technical setup suggests that the stock is well-positioned for further upside movement in the near term.
Strategy: Buy
Target: Rs 780
Stop-Loss: Rs 721
Disclaimer: The views and investment tips expressed by investment experts on Moneycontrol.com are their own and not those of the website or its management. Moneycontrol.com advises users to check with certified experts before taking any investment decisions.
Discover the latest Business News, Sensex, and Nifty updates. Obtain Personal Finance insights, tax queries, and expert opinions on Moneycontrol or download the Moneycontrol App to stay updated!
Find the best of Al News in one place, specially curated for you every weekend.
Stay on top of the latest tech trends and biggest startup news.


