


The benchmark index Nifty 50 saw profit booking on September 13 after a 1.9 percent rally in the previous session, falling by 32 points to 25,357. The market breadth was positive, with 1,551 shares advancing and 904 shares declining on the NSE. The index may consolidate before showing the next leg of the upmove towards a new high. Below are some trading ideas for the near term:
Vinay Rajani, CMT, Senior Technical/Derivative Analyst at HDFC Securities
Piramal Enterprises | CMP: Rs 1,119
Piramal Enterprises has broken out of a bullish “Flag” pattern on the daily chart, indicating the continuation of an uptrend. The price rise was accompanied by healthy volumes. The stock is trading above all important moving averages, indicating a bullish trend across all time frames. Indicators and oscillators have turned bullish on the daily and weekly charts. The stock price has started forming higher tops and higher bottoms on the daily charts.
Strategy: Buy
Target: Rs 1,188, Rs 1,270
Stop-Loss: Rs 1,030
Star Health and Allied Insurance Company | CMP: Rs 618
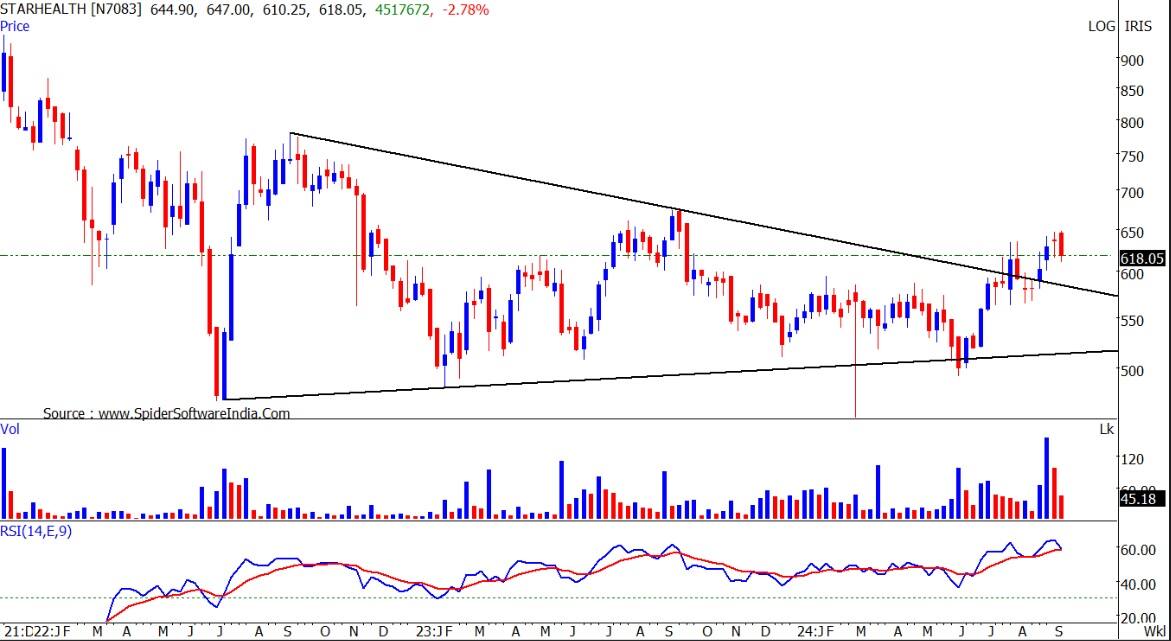
On the weekly chart, Star Health has been forming higher tops and higher bottoms, indicating a primary uptrend. In the last few days, the stock has shown some retracement, which could be utilized to go long. The recent price fall has been accompanied by subdued volumes. The stock is trading above all important moving averages, indicating a bullish trend on all time frames. Indicators and oscillators have also turned bullish on the daily and weekly charts.
Strategy: Buy
Target: Rs 690, Rs 732
Stop-Loss: Rs 587
Ceat | CMP: Rs 3,003

Ceat has broken out of an Inverted Head and Shoulders pattern on the weekly chart. The price rise is accompanied by a jump in volumes. The primary trend of the stock has been bullish, with higher tops and higher bottoms on the weekly and daily charts. Short-term moving averages are positioned above long-term moving averages.
Strategy: Buy
Target: Rs 3,300, Rs 3,450
Stop-Loss: Rs 2,800
Rajesh Bhosale, Technical Analyst at Angel One
DLF | CMP: Rs 864

The realty sector has been in a consolidation phase for the past few months, and DLF has also experienced both price-wise and time-wise consolidation. Technically, there are signs indicating that the stock has resumed its uptrend. On the daily chart, after forming a base at the 200 SMA (Simple Moving Average), prices have shown strong positive traction and a range breakout. Additionally, prices closed above the 20, 50, and 89 EMAs in a single day, highlighting the significance of the move, which is supported by increased volumes. Furthermore, the RSI Smoothened indicator is giving a fresh buy signal and crossing above 50, reinforcing the bullish outlook. Hence, we recommend buying DLF around Rs 863 - Rs 857.
Strategy: Buy
Target: Rs 920
Stop-Loss: Rs 834
Rain Industries | CMP: Rs 185

For over six months, Rain Industries has been trading within a range of Rs 150–180. The recent breakout above this range confirms a bullish 'Rectangular Channel' breakout. This move is supported by a bullish candlestick pattern and increasing volume. Additionally, the RSI (Relative Strength Index) has broken beyond its crucial range, indicating a shift and suggesting the potential for a strong upmove in the near term. Hence, we recommend buying Rain Industries around Rs 184 - Rs 182.
Strategy: Buy
Target: Rs 202
Stop-Loss: Rs 174.80
Rajesh Palviya, Senior Vice President Research (Head Technical Derivatives) at Axis Securities
Bajaj Finserv | CMP: Rs 1,895

On the weekly chart, Bajaj Finserv has decisively broken out of a four-year "symmetrical triangle" pattern at Rs 1,745 levels on a closing basis. This breakout is accompanied by huge volume, indicating increased participation. On the daily chart, the stock has also confirmed a "Flag" continuation pattern, indicating the continuation of the prior uptrend. Recently, the stock has recaptured its 20, 50, 100, and 200-day SMA and rebounded sharply, which reconfirms the bullish trend. These averages are also inching up along with the price rise, supporting bullish momentum. The weekly "Band Bollinger" buy signal shows increased momentum. The daily, weekly, and monthly RSI indicators are in positive terrain, justifying rising strength across all time frames. Investors should buy, hold, and accumulate this stock.
Strategy: Buy
Target: Rs 2,000, Rs 2,150
Stop-Loss: Rs 1,845
Britannia Industries | CMP: Rs 6,133

Britannia is in a strong uptrend across all time frames, which shows bullish sentiment. On the daily chart, the stock has confirmed a "rounding bottom," indicating the continuation of the prior uptrend. The stock is well-placed above its 20, 50, 100, and 200-day SMA, and these averages are also inching up along with the price rise, reaffirming the bullish trend. The daily, weekly, and monthly RSI indicators are in positive terrain, justifying rising strength across all time frames. Investors should buy, hold, and accumulate this stock.
Strategy: Buy
Target: Rs 6,350, Rs 6,550
Stop-Loss: Rs 6,000
Grasim Industries | CMP: Rs 2,784
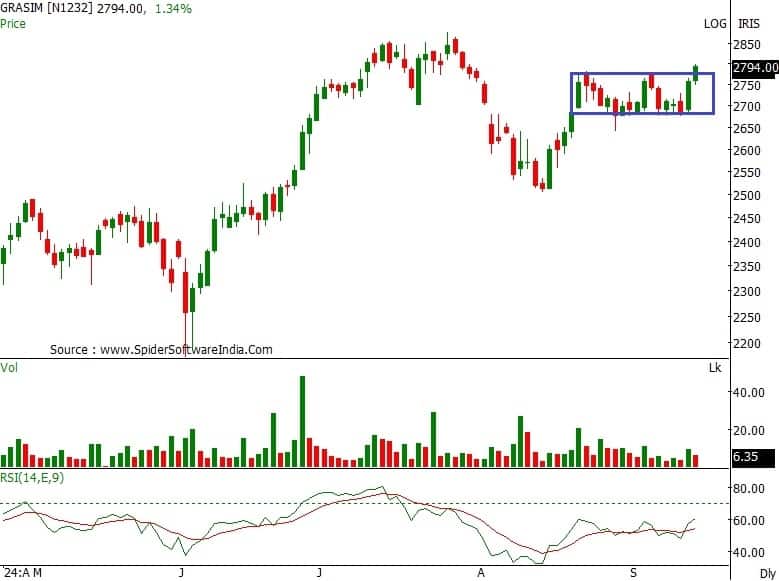
On the daily chart, Grasim has confirmed a three-week "multiple resistance" zone of Rs 2,770 on a closing basis, indicating a positive bias. The stock has recaptured the 20-day SMA and rebounded sharply, indicating positive bias. The daily, weekly, and monthly RSI indicators are in positive terrain, justifying rising strength across all time frames. Investors should buy, hold, and accumulate this stock.
Strategy: Buy
Target: Rs 2,900, Rs 2,985
Stop-Loss: Rs 2,740
Disclaimer: The views and investment tips expressed by investment experts on Moneycontrol.com are their own and not those of the website or its management. Moneycontrol.com advises users to check with certified experts before taking any investment decisions.
Discover the latest Business News, Sensex, and Nifty updates. Obtain Personal Finance insights, tax queries, and expert opinions on Moneycontrol or download the Moneycontrol App to stay updated!
Find the best of Al News in one place, specially curated for you every weekend.
Stay on top of the latest tech trends and biggest startup news.


