


The benchmark indices hit a fresh all-time high but closed in the red after volatility on September 18, with negative market breadth. About 1,725 shares declined, while 755 shares advanced on the NSE. The Nifty 50 is expected to remain rangebound before moving in a firm direction. Below are some trading ideas for the near term:
Jatin Gedia, Technical Research Analyst at Sharekhan by BNP Paribas
Quess Corp | CMP: Rs 841
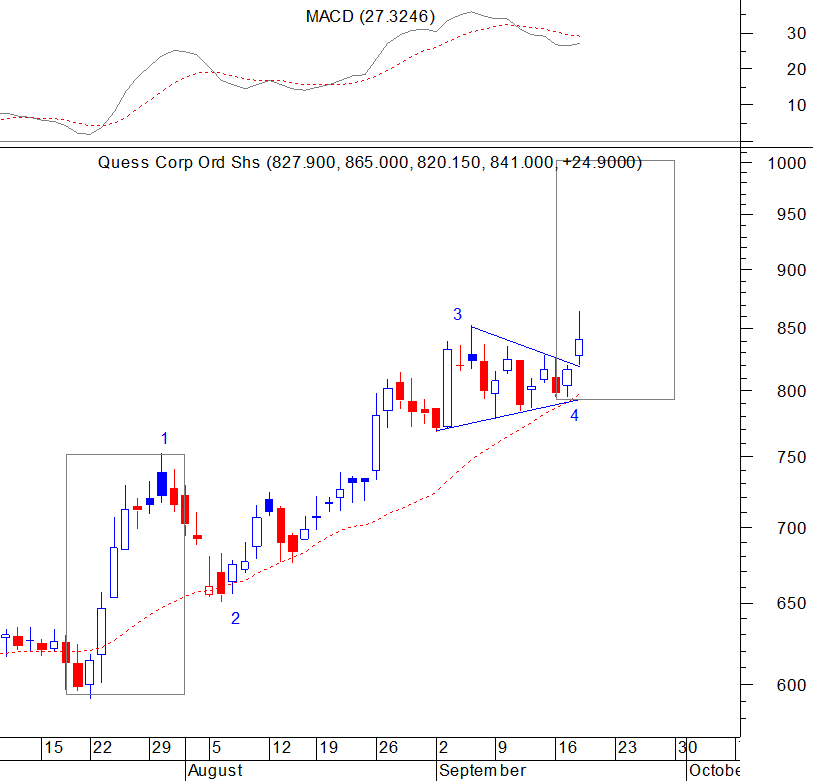
Quess Corp has broken out of a Symmetrical Triangle pattern on the upside. According to the Elliott Wave principle, the stock has started wave 5 of an impulse on the upside. The equality target of the wave comes in at Rs 1,000, where wave 1 equals wave 5. Traders can initiate fresh long positions for a target of Rs 950 – 1,000, with a stop-loss of Rs 795.
Strategy: Buy
Target: Rs 950, Rs 1,000
Stop-Loss: Rs 795
Coromandel International | CMP: Rs 1,730

Coromandel International has formed a Hammer Pattern at the support of the 40-day exponential moving average. Additionally, it has broken out of a Flag pattern on the upside, suggesting a resumption of the upmove. One can go long on the stock with a stop-loss of Rs 1,680, targeting Rs 1,796 and Rs 1,825 from a short-term perspective.
Strategy: Buy
Target: Rs 1,796, Rs 1,825
Stop-Loss: Rs 1,680
Rohan Shah, Technical Analyst at Asit C Mehta Investment Interrmediates
Bajaj Finance | CMP: Rs 7,631

On the daily chart, Bajaj Finance has surpassed its multi-month supply zone and registered a breakout from the consolidation range. The breakout is supported by a noticeable surge in volumes, further confirming the movement. The momentum indicator RSI (Relative Strength Index) has shifted its range and is trading at multi-month high readings, indicating strength and supporting the bullish bias.
Strategy: Buy
Target: Rs 8,150, Rs 8,200
Stop-Loss: Rs 7,380
Max Financial Services | CMP: Rs 1,140.55

MFSL recently registered a breakout from the multi-month Volatility Contraction Pattern (VCP) with decent volumes, highlighting a potential shift in trend from corrective to positive. After the breakout, the price witnessed a shallow retracement and rebounded strongly, finding support around the neckline of the mentioned pattern, which denotes inherent strength in the trend. Momentum indicators RSI and MACD (Moving Average Convergence Divergence) are in bullish territory, suggesting momentum in price.
Strategy: Buy
Target: Rs 1,260, Rs 1,300
Stop-Loss: Rs 1,080
Nestle India | CMP: Rs 2,597

Nestle India has concluded a breakout from an elevated basing pattern, which formed at the long-term moving average (200 DEMA). The stock has also managed to surpass key moving averages, indicating overall strength in the trend. On the relative front, the Nestle India versus Nifty 50 ratio chart has rebounded higher, finding support near its previous key cycle low, suggesting the stock is likely to outperform the benchmark index, showcasing inherent strength.
Strategy: Buy
Target: Rs 2,800
Stop-Loss: Rs 2,450
Vidnyan S Sawant, Head of Research at GEPL Capital
Indian Hotels | CMP: Rs 681

Indian Hotels has demonstrated strong momentum on the monthly scale since 2020, maintaining a consistent uptrend while respecting its key 12-month EMA (Exponential Moving Average). On the weekly scale, the stock recently broke out of a consolidation range, signaling a likely upward trajectory. It remains well-supported above its 12-week and 26-week EMAs, with the MACD showing a bullish crossover and a rising histogram, indicating accelerating momentum.
Strategy: Buy
Target: Rs 815
Stop-Loss: Rs 624
Va Tech Wabag | CMP: Rs 1,397

Va Tech Wabag has displayed a strong price structure since 2022, consistently forming higher tops and bottoms. In April 2024, the stock achieved a multi-year breakout above the 2014 swing high. Following this breakout, the stock continued to maintain higher lows, reinforcing its readiness for an upward trajectory. On the weekly scale, Va Tech Wabag has upheld its uptrend, respecting both the 12-week and 26-week EMAs. The ratio chart of Va Tech Wabag against the Nifty highlights a rising trend, signaling continued outperformance.
Strategy: Buy
Target: Rs 1,700
Stop-Loss: Rs 1,280
Natco Pharma | CMP: Rs 1,543

Natco Pharma is currently trading at an all-time high, indicating strong momentum. The stock has consistently formed higher highs and higher lows on the weekly scale. Throughout this uptrend, it has shown bullish mean reversion from minor dips, with buying interest near the 12-week and 26-week moving averages, underscoring strong price structural development. Additionally, in June 2024, the ratio chart of Natco Pharma versus Nifty broke out of a sloping trendline that had been in place since 2017. This breakout signals the stock's strong price structure and indicates its potential for continued outperformance compared to the broader market.
Strategy: Buy
Target: Rs 1,806
Stop-Loss: Rs 1,420
Sarda Energy and Minerals | CMP: Rs 423
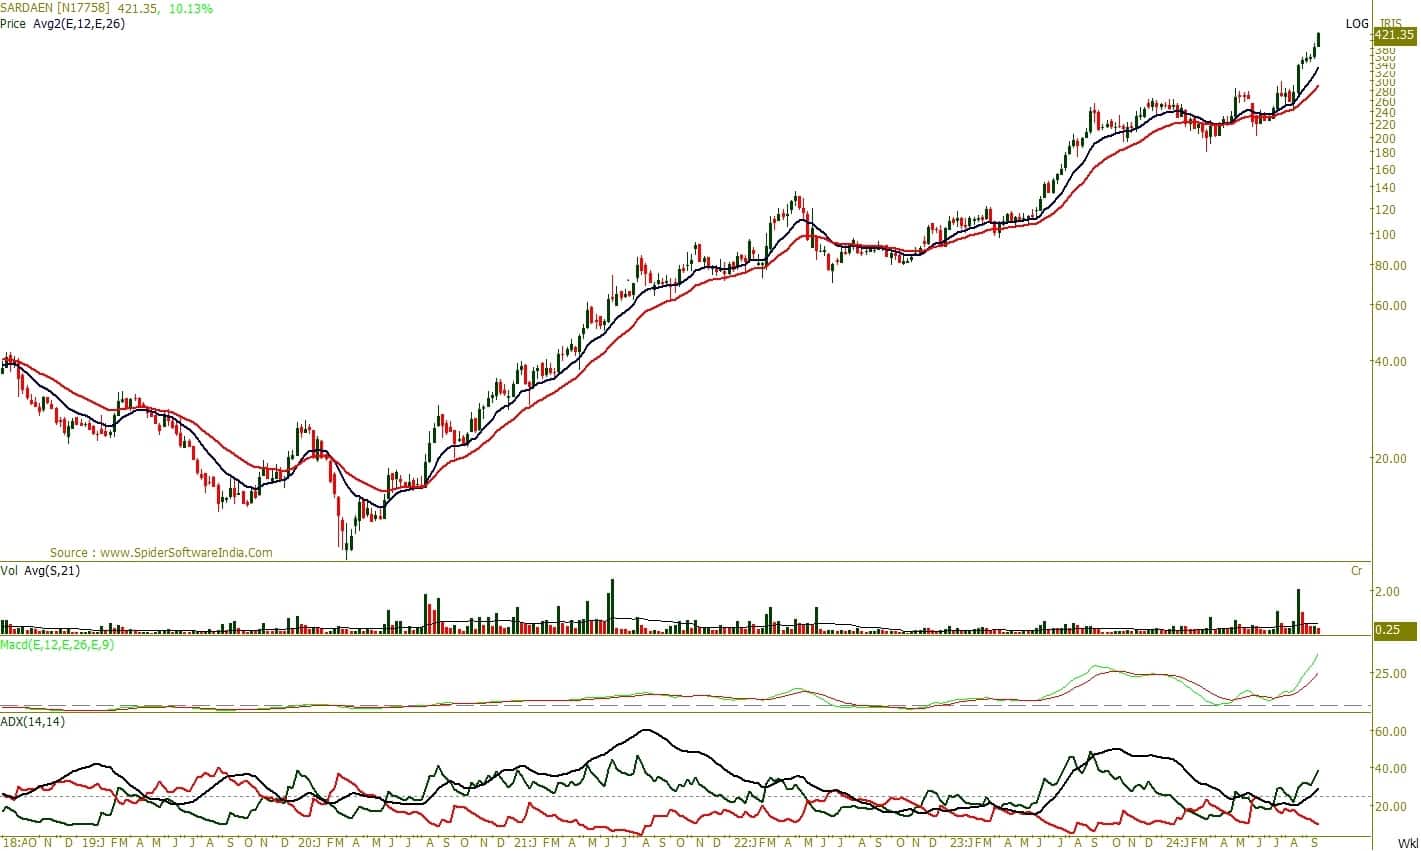
Sarda Energy has exhibited a robust price structure, with a breakout from a consolidation phase in August 2024, which had lasted since September 2023. Following the breakout, the stock has sustained its higher high and higher low formation on the weekly scale. The MACD momentum indicator remains in buy mode, while the ADX (Average Directional Index) further confirms the strength of the upward trend, with the ADX above 25 and the +DI above 30, reinforcing bullish momentum. The stock shows potential for further upside.
Strategy: Buy
Target: Rs 505
Stop-Loss: Rs 387
Shitij Gandhi, Senior Technical Research Analyst at SMC Global Securities
Havells India | CMP: Rs 1,988

Havells has maintained its bull run since the beginning of the year, with prices rising in the formation of a higher-bottom pattern on both daily and weekly intervals. However, over the last three months, the stock has been consolidating in a broader range of Rs 1,700-1,950. A fresh breakout has been observed on the charts this week, as momentum is picking up above the symmetrical triangle pattern on the daily interval. Therefore, one can buy, hold, or accumulate the stock.
Strategy: Buy
Target: Rs 2,250, Rs 2,275
Stop-Loss: Rs 1,950
Hikal | CMP: Rs 380.5

Recently, Hikal has witnessed a breakout above the symmetrical triangle pattern, followed by buying, which led the stock to mark its 52-week high of Rs 410.90 this week. The price action was accompanied by rising volumes, pointing towards further upside. Therefore, one can buy, hold, or accumulate the stock on dips till Rs 370 for the expected upside of Rs 430-435 levels.
Strategy: Buy
Target: Rs 430, Rs 435
Stop-Loss: Rs 330
Disclaimer: The views and investment tips expressed by investment experts on Moneycontrol.com are their own and not those of the website or its management. Moneycontrol.com advises users to check with certified experts before taking any investment decisions.
Discover the latest Business News, Sensex, and Nifty updates. Obtain Personal Finance insights, tax queries, and expert opinions on Moneycontrol or download the Moneycontrol App to stay updated!
Find the best of Al News in one place, specially curated for you every weekend.
Stay on top of the latest tech trends and biggest startup news.


