


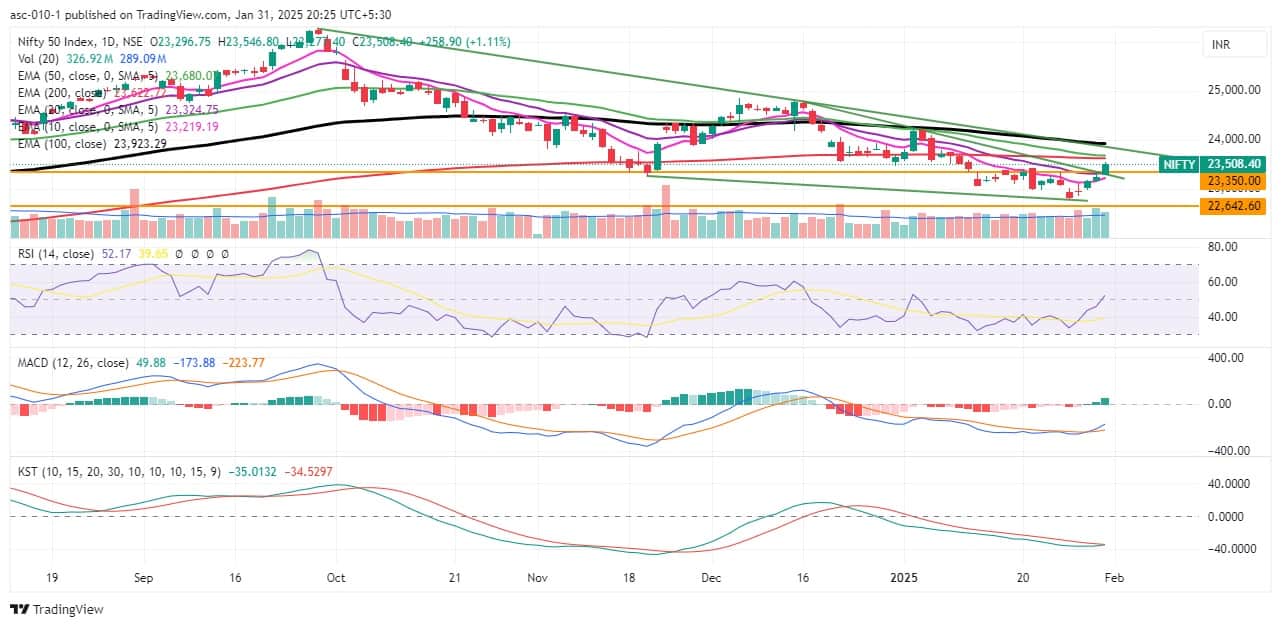
Relentless buying interest continued in the equity benchmarks for four consecutive days, rising more than 1 percent on January 31 and signaling optimism among market participants ahead of the Union Budget scheduled to be presented on February 1. In fact, the Nifty 50 also had a healthy start to the February series on Friday, surpassing short-term moving averages, and there was a strong resistance trendline breakout with above-average volumes. Hence, if the index continues its upward journey, the immediate hurdle zone on the higher side lies between 23,620 and 23,680 (200-day EMA, 50-day EMA), followed by 23,800-23,900 (trendline resistance and 100-day EMA) as the next resistance. However, in the case of a trend reversal, the immediate support may be at 23,300, followed by 23,000, which is considered crucial support, according to experts.
The market will remain open on February 1, Saturday, for Union Budget.
Here are 15 data points we have collated to help you spot profitable trades:
1) Key Levels For The Nifty 50 (23,508)
Resistance based on pivot points: 23,547, 23,611, and 23,714
Support based on pivot points: 23,341, 23,278, and 23,175
Special Formation: The Nifty 50 recorded its biggest single-day gains since January 2 and formed a long bullish candlestick pattern on the daily charts. Additionally, with the index closing above the lower high of January 21 (23,426), there seems to be a reversal of the bearish pattern of lower tops-lower bottoms seen in the last month, indicating bullish development. The momentum indicator RSI (Relative Strength Index at 52.17) entered the upper band with a positive bias, while MACD (Moving Average Convergence Divergence) also showed a positive crossover but remained below the zero line. On the hourly charts, the index climbed above all key moving averages, with a positive bias in both RSI and MACD. On the weekly timeframe, the index closed above the 50-week EMA and formed a robust bullish candle that completely engulfed the previous two weeks' candles, signaling positivity.
2) Key Levels For The Bank Nifty (49,587)
Resistance based on pivot points: 49,677, 49,829, and 50,074
Support based on pivot points: 49,186, 49,034, and 48,788
Resistance based on Fibonacci retracement: 50,381, 51,158
Support based on Fibonacci retracement: 47,875, 46,078
Special Formation: The Bank Nifty also formed a bullish candlestick pattern on the daily charts, maintaining its upward trend and higher low formation for the fourth consecutive session. The index gained 0.6 percent and sustained above short-term moving averages (10, 20-day EMAs), while volumes remained above average for five consecutive days. On the weekly timeframe, the index surged 2.52 percent (its biggest weekly gain since the first week of December 2024) and formed a large bullish candle, engulfing the previous two weeks' candles.

According to the weekly options data, the 24,000 strike holds the maximum Call open interest (with 77.11 lakh contracts). This level can act as a key resistance for the Nifty in the short term. It was followed by the 23,500 strike (44.33 lakh contracts) and the 24,500 strike (42.39 lakh contracts).
Maximum Call writing was observed at the 24,000 strike, which saw an addition of 44.65 lakh contracts, followed by the 23,500 and 23,600 strikes, which added 21.52 lakh and 21.4 lakh contracts, respectively. The maximum Call unwinding was seen at the 23,200 strike which shed 1.69 lakh contracts, followed by the 23,000 and 22,800 strikes which shed 1.17 lakh and 44,250 contracts, respectively.
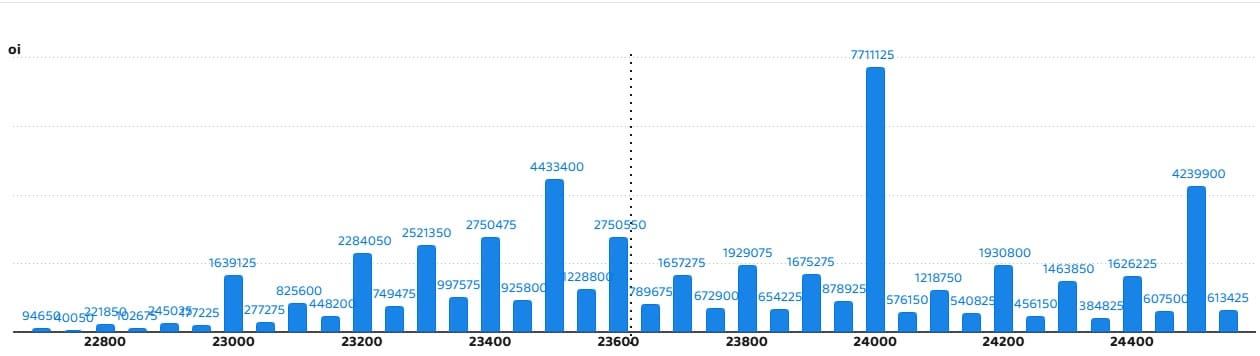
On the Put side, the maximum Put open interest was seen at the 23,000 strike (with 56.53 lakh contracts), which can act as a key support level for the Nifty. It was followed by the 23,500 strike (52.66 lakh contracts) and the 23,400 strike (46.94 lakh contracts).
The maximum Put writing was placed at the 23,500 strike, which saw an addition of 43.05 lakh contracts, followed by the 23,400 and 23,300 strikes, which added 40.39 lakh and 29.52 lakh contracts, respectively. There was hardly any Put unwinding seen in 22,700-24,550 strike band.

5) Bank Nifty Call Options Data
According to the monthly options data, the 50,000 strike holds the maximum Call open interest, with 7.15 lakh contracts. This can act as a key resistance level for the index in the short term. It was followed by the 51,000 strike (7.01 lakh contracts) and the 49,000 strike (6.66 lakh contracts).
Maximum Call writing was visible at the 50,000 strike (with the addition of 1.15 lakh contracts), followed by the 49,800 strike (90,030 contracts) and the 49,600 strike (86,640 contracts). The maximum Call unwinding was seen at the 49,000 strike, which shed 35,880 contracts, followed by the 48,500 and 49,200 strikes, which shed 12,990 and 10,440 contracts, respectively.
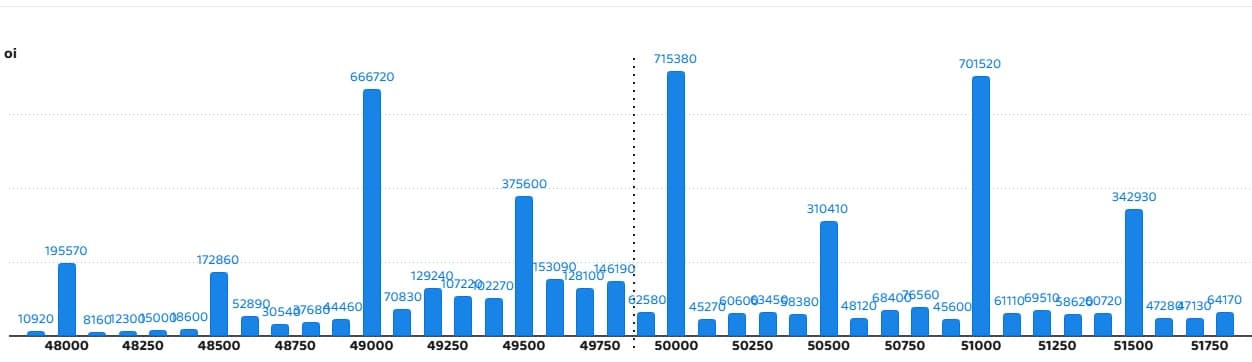
6) Bank Nifty Put Options Data
On the Put side, the maximum Put open interest was seen at the 49,000 strike (with 10.05 lakh contracts), which can act as a key support level for the index. This was followed by the 48,000 strike (6.54 lakh contracts) and the 50,000 strike (5.75 lakh contracts).
The maximum Put writing was observed at the 48,000 strike (which added 1.52 lakh contracts), followed by the 49,500 strike (1.05 lakh contracts) and the 50,000 strike (84,180 contracts). There was hardly any Put unwinding seen in the 47,900-51,800 strike band.

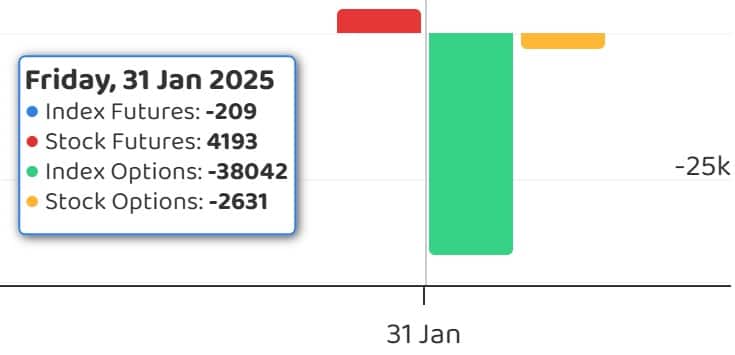
7) Funds Flow (Rs crore)
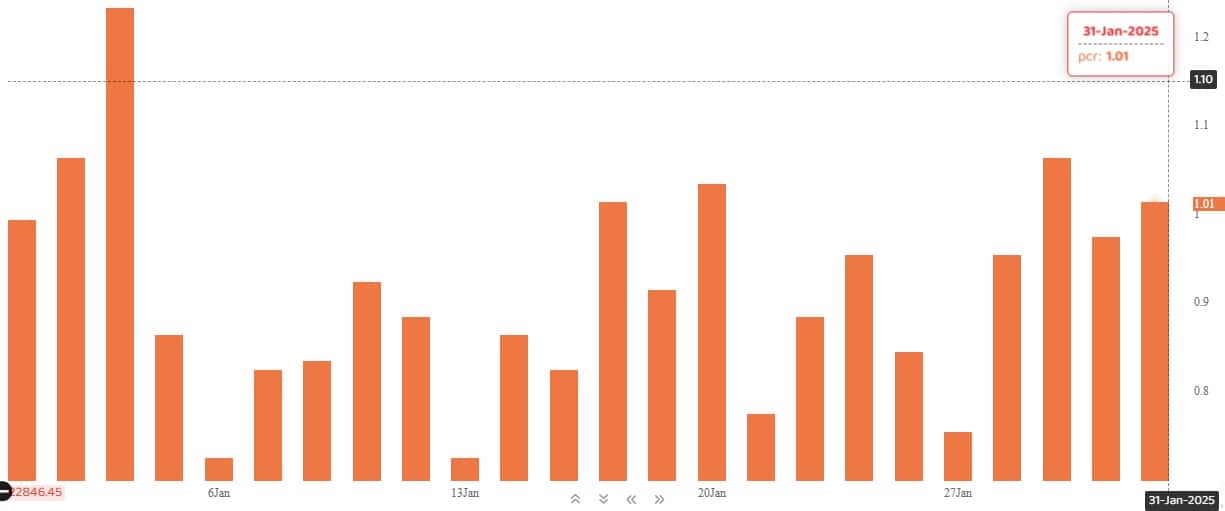
The Nifty Put-Call ratio (PCR), which indicates the mood of the market, climbed to 1.01 on January 31, from 0.97 level in the previous session.
The increasing PCR, or being higher than 0.7 or surpassing 1, means traders are selling more Put options than Call options, which generally indicates the firming up of a bullish sentiment in the market. If the ratio falls below 0.7 or moves towards 0.5, then it indicates selling in Calls is higher than selling in Puts, reflecting a bearish mood in the market.
9) India VIX
The India VIX, the fear index that measures expected market volatility, dropped sharply for another session, falling 6.57 percent to 16.25. This trend made the market favourable for bulls, but caution is still required as the market approaches the Union Budget, with the VIX trading well above the 14 mark.

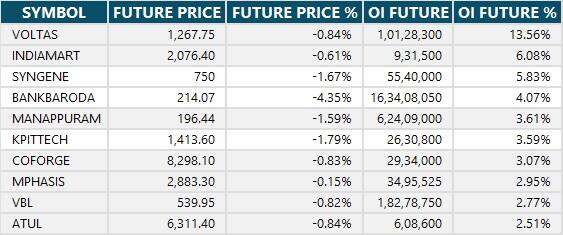
A long build-up was seen in 78 stocks. An increase in open interest (OI) and price indicates a build-up of long positions.

11) Long Unwinding (14 Stocks)
14 stocks saw a decline in open interest (OI) along with a fall in price, indicating long unwinding.

12) Short Build-up (25 Stocks)
25 stocks saw an increase in OI along with a fall in price, indicating a build-up of short positions.
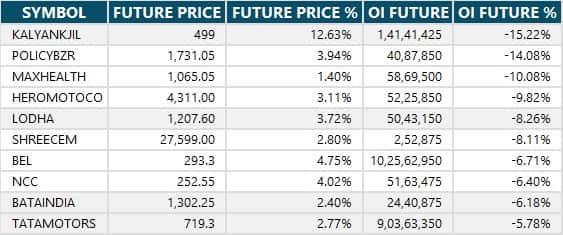
13) Short-Covering (110 Stocks)
110 stocks saw short-covering, meaning a decrease in OI, along with a price increase.
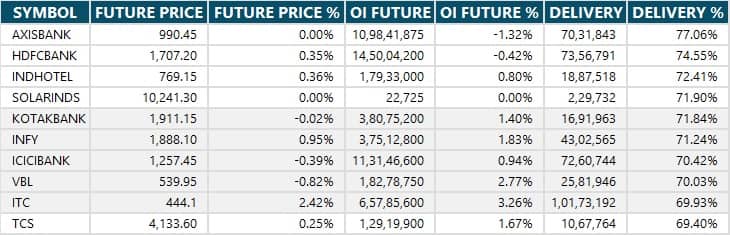
Here are the stocks that saw a high share of delivery trades. A high share of delivery reflects investing (as opposed to trading) interest in a stock.
Securities banned under the F&O segment include companies where derivative contracts cross 95 percent of the market-wide position limit.
Stocks added to F&O ban: Nil
Stocks retained in F&O ban: Nil
Stocks removed from F&O ban: Nil
Disclaimer: The views and investment tips expressed by experts on Moneycontrol are their own and not those of the website or its management. Moneycontrol advises users to check with certified experts before taking any investment decisions.
Disclosure: Moneycontrol is a part of the Network18 group. Network18 is controlled by Independent Media Trust, of which Reliance Industries is the sole beneficiary.
Discover the latest Business News, Sensex, and Nifty updates. Obtain Personal Finance insights, tax queries, and expert opinions on Moneycontrol or download the Moneycontrol App to stay updated!
Find the best of Al News in one place, specially curated for you every weekend.
Stay on top of the latest tech trends and biggest startup news.


