


The market recouped all its previous week's losses and climbed to the highest level of this calendar year on May 26, thanks to the stellar rally put up by the benchmark indices on Friday. The buying was seen across sectors during the week with Metal, Pharma, IT and FMCG being the biggest gainers.
As a result, the Nifty50 surged nearly 300 points or 1.6 percent to 18,499.35 during the last week, and formed a strong bullish candlestick pattern on the weekly charts, with consistently making higher high formation for the ninth consecutive week.
Given the strong momentum and breaking of the last eight-day consolidation, the index is likely to march towards the 18,700-18,800 zone in the coming sessions, with support at 18,400-18,300 levels, experts said. Even the Options data indicated that the Nifty50 may climb towards 18,700-19,000 zone, with crucial support at 18,400-18,200 levels.
"We can see breakout happening on daily time frame chart which is likely to unfold the next leg of the rally to head towards 18,700 first and then if the momentum persists, the new high is imminent soon," Sameet Chavan, Head of Research for Technical and Derivatives at Angel One, said.
On the flipside, he feels 18,350 followed by 18,200 should be considered as immediate supports.
Ideally, in case of any blip in the current week, Sameet is likely to see buying emerging from the mentioned demand zone. Traders are advised to stick to optimistic stance and use intra-week dips to add bullish bets, he said.
According to, Mitesh Karwa, Research Analyst at Bonanza Portfolio, the coming week is of extreme importance and will decide the trend for the next leg. "The 18,350-18,400 levels are expected to act as a strong support zone and if held in the forthcoming week, the Nifty will start moving towards 19,000 levels," he said.
On the indicator front, the momentum indicator Relative Strength Index RSI (14) is showing a reading of 67 and Nifty is trading above its 200 EMA at 17,671 which indicates strength.
Let's take a look at the top 10 trading ideas by experts for the next three-four weeks. Returns are based on the May 26 closing prices:
Expert: Shrikant Chouhan, Head of Equities Research (Retail) at Kotak Securities
United Breweries: Buy | LTP: Rs 1,460 | Stop-Loss: Rs 1,300 | Target: Rs 1,650 | Return: 13 percent
The stock started to diverge positively after hitting new lows in the short term. It was at Rs 1,800 level in December 2022 and overall it fell to Rs 1,350 level in less than five months.
Based on key oscillators such as MACD (moving average convergence divergence) and RSI (relative strength index), it is diverging positively, indicating a change in the prevailing trend. Based on it, we can expect a pullback rally in the near term.
The strategy should be to buy 50 percent at current levels and the rest at Rs 1,350. For this, put a stop-loss at Rs 1,300. A pullback could extend further towards Rs 1,650 with a major resistance near Rs 1,550.

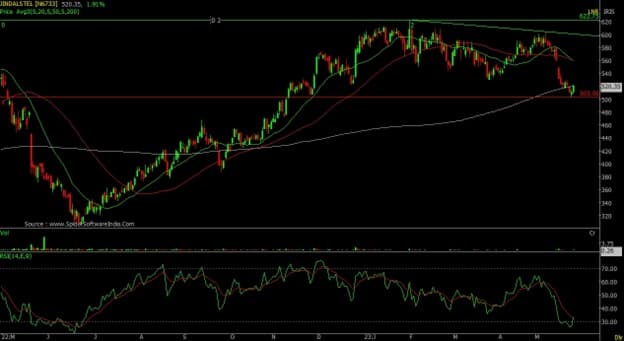
Jindal Steel & Power: Buy | LTP: Rs 520 | Stop-Loss: Rs 490 | Target: Rs 580 | Return: 11.5 percent
The stock has completed the first leg of the corrective pattern at Rs 500. It was a price and time-based correction for the stock. It was at Rs 620 and fell to Rs 500 in a span of four months, which is 50 percent of the time the rally displayed from Rs 300 level.
Based on the wave theory, it would start trending higher and preparing for a bigger pullback in the near term. We should be a buyer with a strict stop-loss at Rs 490.
If it breaks Rs 490, it will trigger further correction and may drop to extreme levels. At current levels, buy 50 percent and buy the rest around Rs 505. Keep stop-loss at Rs 490 and target at Rs 550 and Rs 580.
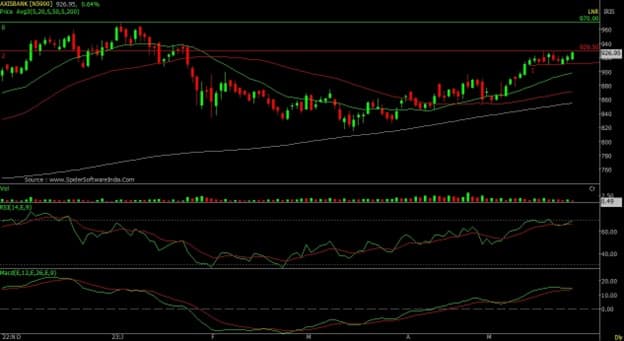
Axis Bank: Buy | LTP: Rs 927 | Stop-Loss: Rs 904 | Target: Rs 970 | Return: 5 percent
The stock is in the formation of rounding bottom. It moved the prices upwards but gradually. Based on it, the stock can go up to Rs 960 or Rs 970 in the medium term.
For the last two weeks, the stock is in a tight trading range of Rs 908 and Rs 930. This could be a bullish continuation, which could help the stock move towards Rs 970 levels. The strategy should be to buy between Rs 930 and Rs 920, and place a stop-loss at Rs 904.
Expert: Nandish Shah, Senior Derivative and Technical Analyst at HDFC Securities
Karnataka Bank: Buy | LTP: Rs 143.75 | Stop-Loss: Rs 135 | Target: Rs 154-161 | Return: 12 percent
The stock price has broken out on the daily chart from the downward sloping trendline, adjoining the highs of March 9, 2023 and May 18, 2023. Rise in the price is accompanied by the surge in volumes suggesting strength in the uptrend.
Momentum Oscillators - RSI (relative strength index 11) and MFI (money flow index 10) is sloping upwards and placed above 50 on the daily and weekly chart, indicating strength in the stock.

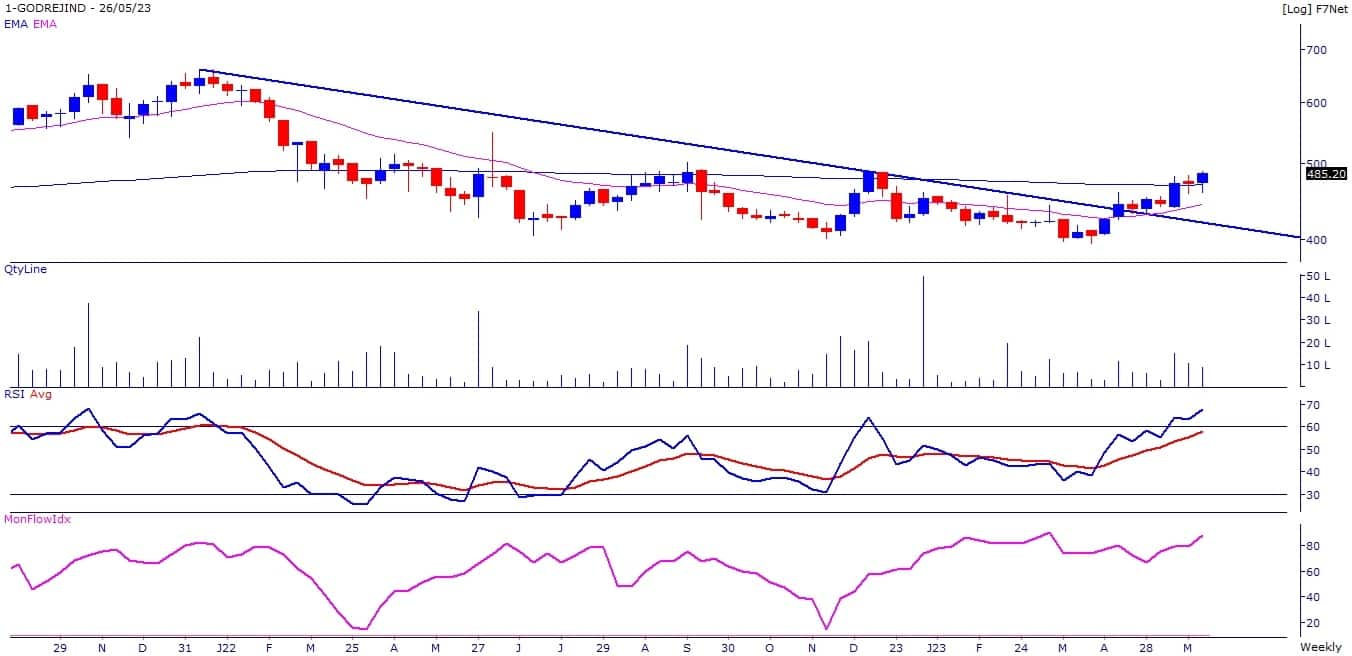
Godrej Industries: Buy | LTP: Rs 485 | Stop-Loss: Rs 455 | Target: Rs 520-540 | Return: 11 percent
The stock price has broken out on the weekly chart from the downward sloping trendline, adjoining the highs of January 7, 2022 and December 16, 2022. The stock price has broken out on the daily chart with higher volumes to close at highest level since December 9, 2022.
The stock price has formed multiple bottoms around Rs 400 levels on the daily chart. Plus DI (directional indicator) is trading above minus DI while ADX (average directional index) line is placed above 25, Indicating stock price is likely to gather momentum in the coming days.
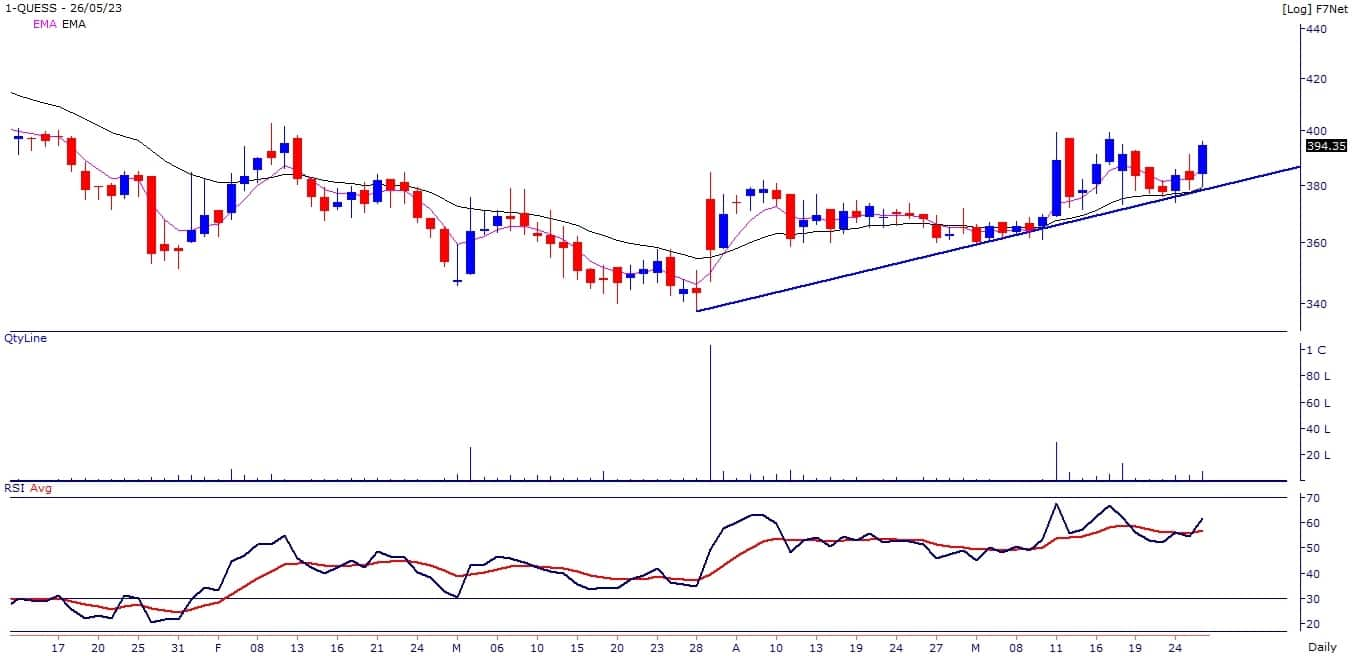
Quess Corp: Buy | LTP: Rs 394 | Stop-loss Rs 370 | Target: Rs 422-435 | Return: Rs 10 percent
The stock price has broken out on the daily chart with higher volumes to close at highest level since May 17, 2023. Short term trend turned positive as stock price closed above its 5 and 11-day EMA (exponential moving average).
Momentum Oscillators - RSI (11) and MFI (10) is sloping upwards and placed above 50 on the daily chart, indicating strength in the current uptrend of the stock. Plus DI is trading above minus DI while ADX line is placed above 25, Indicating stock price is likely to gather momentum in the coming days.
Expert: Ruchit Jain, Lead Research at 5paisa.com
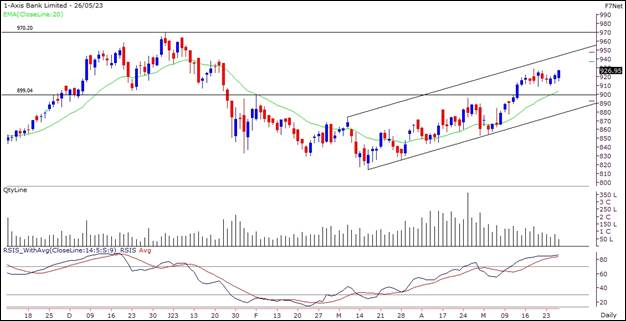
Axis Bank: Buy | LTP: Rs 927 | Stop-Loss: Rs 903 | Target: Rs 948-965 | Return: 4 percent
Along with the banking index, this stock has seen a time-wise correction in last couple of weeks. However, prices have consolidated above its crucial supports and the short term up trend still remains intact.
The RSI oscillator is hinting at a positive momentum and hence, we expect the stock to rally towards the higher end of the channel in which prices are moving.
Traders can buy this stock in the range of Rs 926-920 for potential targets of Rs 948 and Rs 965. The stop-loss for long positions should be placed below Rs 903.
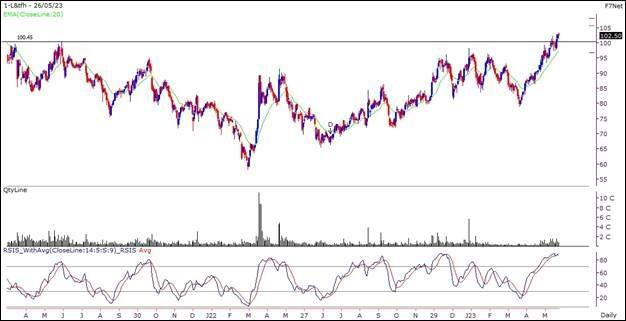
L&T Finance Holdings: Buy | LTP: Rs 102.5 | Stop-Loss: Rs 97 | Targets: Rs 108-112 | Return: 9 percent
The stock has been forming a ‘Higher Top Higher Bottom’ formation and the prices have been gradually moving higher above its 20 DEMA support. The volumes have increased gradually recently and the RSI oscillator is hinting at a positive momentum.
Prices have also given a breakout above its previous swing high resistance and hence, we advise short term traders to look for buying opportunities.
Traders can look to buy the stock in the range of Rs 103-101 for potential targets of Rs 108 and Rs 112. The stop-loss for long positions should be placed below Rs 97.
Expert: Mitesh Karwa, Research Analyst at Bonanza Portfolio
CRISIL: Buy | LTP: Rs 3,702 | Stop-Loss: Rs 3,590 | Target: Rs 3,900 | Return: 5 percent
The stock has seen breaking out of a rounding bottom formation on the weekly timeframe and has closed above the highs of last ten months with a big bullish candlestick pattern, while the supertrend indicator is also indicating a bullish continuation trend which can be used as a confluence towards the bullish view.
On the indicator front, the Ichimoku Cloud is also suggesting a bullish move as the price is trading above the conversion line and base line. Momentum oscillator RSI (14) is at around 65 on the daily time frame indicating strength by sustaining above 50.
Observation of the above factors indicates that a bullish move in CRISIL is possible for targets upto Rs 3,900. One can initiate a buy trade in between the range of Rs 3,696-3,701, with a stop-loss of Rs 3,590 on daily closing basis.
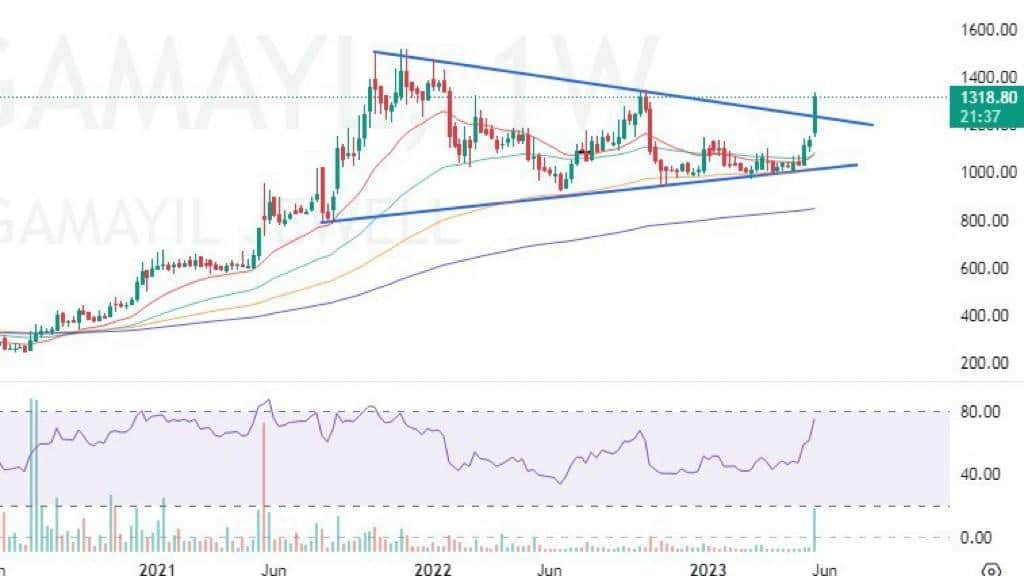
Thangamayil Jewellery: Buy | LTP: Rs 1,323.5 | Stop-Loss: Rs 1,230 | Target: Rs 1,520 | Return: 15 percent
Thangamayil Jewellery has seen breaking out of a triangle pattern on the weekly timeframe with a bullish candlestick and above average volumes. The stock is also trading above important EMAs of 20/50/100/200 which indicates strength.
On the indicator front, the supertrend indicator is indicating a bullish continuation, momentum oscillator RSI (14) is at around 83 on the daily time frame indicating strength by sustaining above 50 and the ichimoku cloud is also suggesting a bullish move as the price is trading above the conversion line and base line on the daily timeframe.
Observation of the above factors indicates that a bullish move in Thangamayil Jewellery is possible for targets upto Rs 1,520. One can initiate a buy trade in the range of Rs 1,320-1,323, with a stop-loss of Rs 1,520 on daily closing basis.
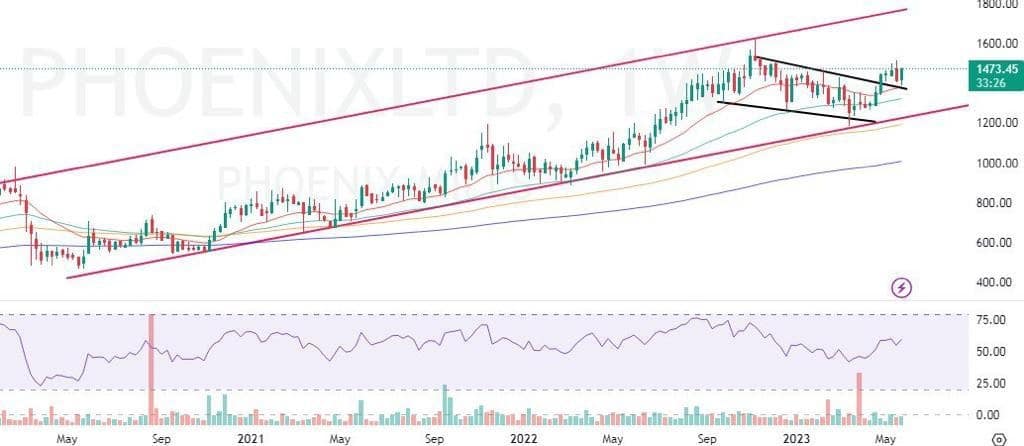
Phoenix Mills: Buy | LTP: Rs 1,479 | Stop-Loss: Rs 1,420 | Target: Rs 1,580 | Return: 7 percent
Phoenix Mills has seen breaking out and sustaining above the breakout of a downwards sloping parallel channel pattern on the weekly timeframe with a bullish candlestick and is trading above all its important EMAs on the daily timeframe which indicates bullish strength.
The supertrend indicator is also indicating a bullish continuation which supports the bullish view. Momentum oscillator RSI (14) is at around 60 on the daily time frame indicating strength by sustaining above 50 and the Ichimoku Cloud is also suggesting a bullish move as the price is trading above the conversion and base line.
Observation of the above factors indicates that a bullish move in Phoenix Mills is possible for target upto Rs 1,580. One can initiate a buy trade in between the range of Rs 1,475-1,479 with a stop-loss of Rs 1,420 on daily closing basis.
Disclaimer: The views and investment tips expressed by investment experts on Moneycontrol.com are their own and not those of the website or its management. Moneycontrol.com advises users to check with certified experts before taking any investment decisions.
Discover the latest Business News, Sensex, and Nifty updates. Obtain Personal Finance insights, tax queries, and expert opinions on Moneycontrol or download the Moneycontrol App to stay updated!
Find the best of Al News in one place, specially curated for you every weekend.
Stay on top of the latest tech trends and biggest startup news.