
Indian equity markets are trading within a range with intraday volatility running high. Global cues are supportive, but we are not reactive to them. Nifty has an immediate resistance zone at 18,200–18,250, while the base has shifted into the 18,000–17,950 zone.
The volatility index, India VIX, is still below the 14 mark, but it is likely to pick up ahead of the Budget. The range is narrowing, but the market can't remain in range for a long time, and we can expect a breakout or breakdown in the coming days where budget will be a key domestic event.
On the upside, if Nifty takes out 18,250 level, then 18,500 and 18,650 will be the next target levels. On the downside, if index slips below 17,950 level, then 17,750 is a sacrosanct support level.
Bank Nifty is also trading rangebound, where 43,000 is an immediate psychological hurdle and 43,500 and 44,000 are the next target levels. On the downside, the 20-DMA of 42,600 is an immediate support level, and 42,000–41,725 is the next support zone.
Here are three buy calls for next 2-3 weeks:
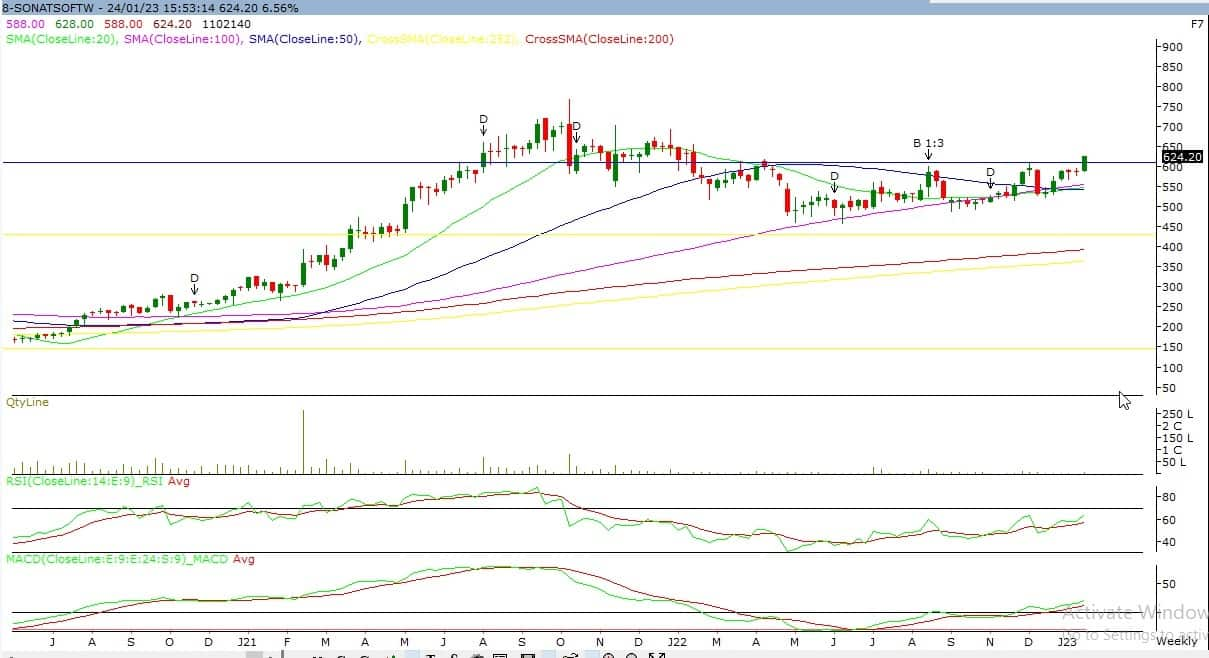
Sonata Software: Buy | LTP: Rs 624 | Stop-Loss: Rs 575 | Target: Rs 724 | Return: 16 percent
The counter is witnessing the breakout of a classic Inverse Head and Shoulder formation, which is then followed by a meaningful correction. It is trading above all its important moving averages with a positive bias in momentum indicators.
On a longer time scale, it is respecting the flag formation breakout.
On the higher side, Rs 650 is acting as an important psychological level; above this, we can expect the level of Rs 700+ in the near-short term, while on the lower side, Rs 575 will act as a major support during any correction.
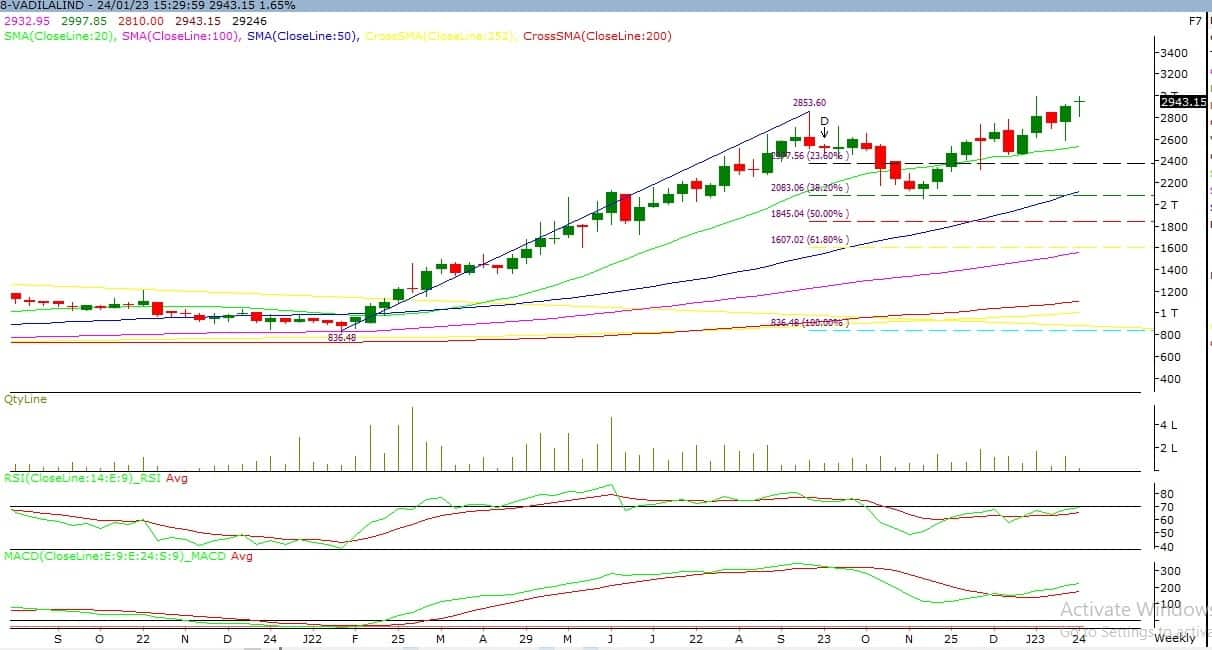
Vadilal Industries: Buy | LTP: Rs 2,943 | Stop-Loss: Rs 2,700 | Target: Rs 3,434 | Return: 16 percent
The counter is in a classical uptrend. It is bouncing back from around a 38.2 percent retracement of the previous rally. It is trading above its all-important moving averages with higher highs and higher low formations.
On the higher time frame, there is a breakout of a bullish flag formation, which suggests much more potential upside in this counter. The momentum indicator RSI (relative strength index) is trading above the 50 mark with a positive bias, whereas MACD (moving average convergence divergence) is witnessing a centerline crossover.
On the upside, Rs 3,000 will be an immediate hurdle, but Rs 3,400+ looks like an imminent target in the near term. On the downside, the 50-DMA or Rs 2,700 is a strong support level.
Gravita India: Buy | LTP: Rs 499 | Stop-Loss: Rs 443 | Target: Rs 600 | Return: 20 percent
The counter is in an awesome uptrend with a breakout of long consolidation and strong volume. The overall structure of the counter is very lucrative, as it is trading above all important moving averages. On the higher time frame, there is a breakout of a Bullish Flag formation, which suggests much more potential upside in this counter.
The momentum indicator RSI is positively poised, whereas MACD is witnessing a centerline crossover on the upside.
On the higher side, Rs 500 is acting as an important psychological level; above this, we can expect the level of Rs 600+ in the near-short term, while on the lower side, Rs 443 will act as a major support during any correction.

Disclaimer: The views and investment tips expressed by investment experts on Moneycontrol.com are their own and not those of the website or its management. Moneycontrol.com advises users to check with certified experts before taking any investment decisions.

Discover the latest Business News, Sensex, and Nifty updates. Obtain Personal Finance insights, tax queries, and expert opinions on Moneycontrol or download the Moneycontrol App to stay updated!
Find the best of Al News in one place, specially curated for you every weekend.
Stay on top of the latest tech trends and biggest startup news.