


On the monthly chart, the Nifty has continued to sustain above previous month's high which indicates bullish undertone in the index. Nifty on the weekly timeframe is forming higher high, higher bottom pattern since past 7 weeks and have sustained above 50-week SMA (simple moving average) which shows bullish sentiment.
On the daily timeframe, we have witnessed a steep rise in the index which tells that the bulls have strong grip over the market.
Going ahead, the immediate resistance for the Nifty is placed at the level of 17,800 and the key resistance at the level of 18,115, 18,350. On the other side, index has its immediate support at the level of 17,350, followed by 17,000.
As per the short term chart pattern, we feel the index will make an attempt to reach its resistance of 17,800 followed by 18,115. Our bullish view shall be negated if we see prices sustaining below 17,350 level.
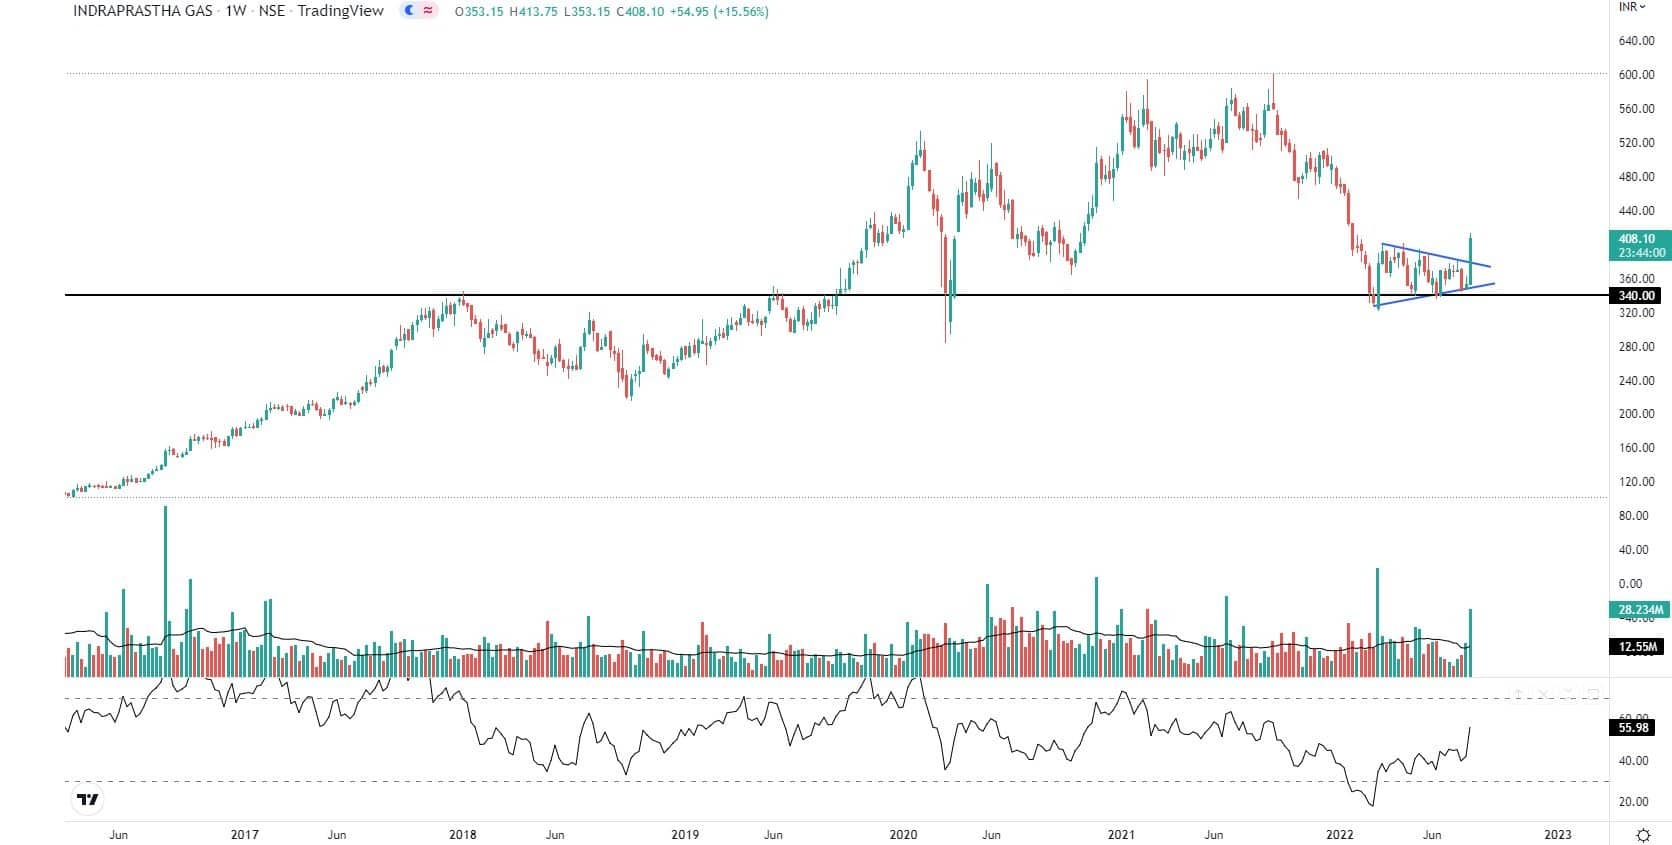
Here are three buy calls for next 2-3 weeks:Indraprastha Gas: Buy | LTP: Rs 408.10 | Stop-Loss: Rs 360 | Target: Rs 470 | Return: 15 percentBy looking at the weekly chart of Indraprastha Gas, we can spot that prices after a strong downtrend witnessed a pause in the form of Symmetrical Triangle around the level of Rs 340. At the same time around Rs 340 level prices also have seen change in polarity.
On the daily timeframe, prices gave a breakout from the Symmetrical Triangle pattern, while indicates beginning of a new trend.
The breakout was accompanied by high volumes and a Gap which confirms the breakout.
The upper Bollinger band plotted on daily time frame have started to expand which tells that the volatility is rising for upside movement.
RSI (relative strength index) on the daily as well as on weekly timeframe have sustained above 50-mark trough which we can infer that prices have the momentum to go higher.
We expect the stock to go higher till the level of Rs 470 whereas the stop-loss for it must be placed at Rs 360 on the closing basis.
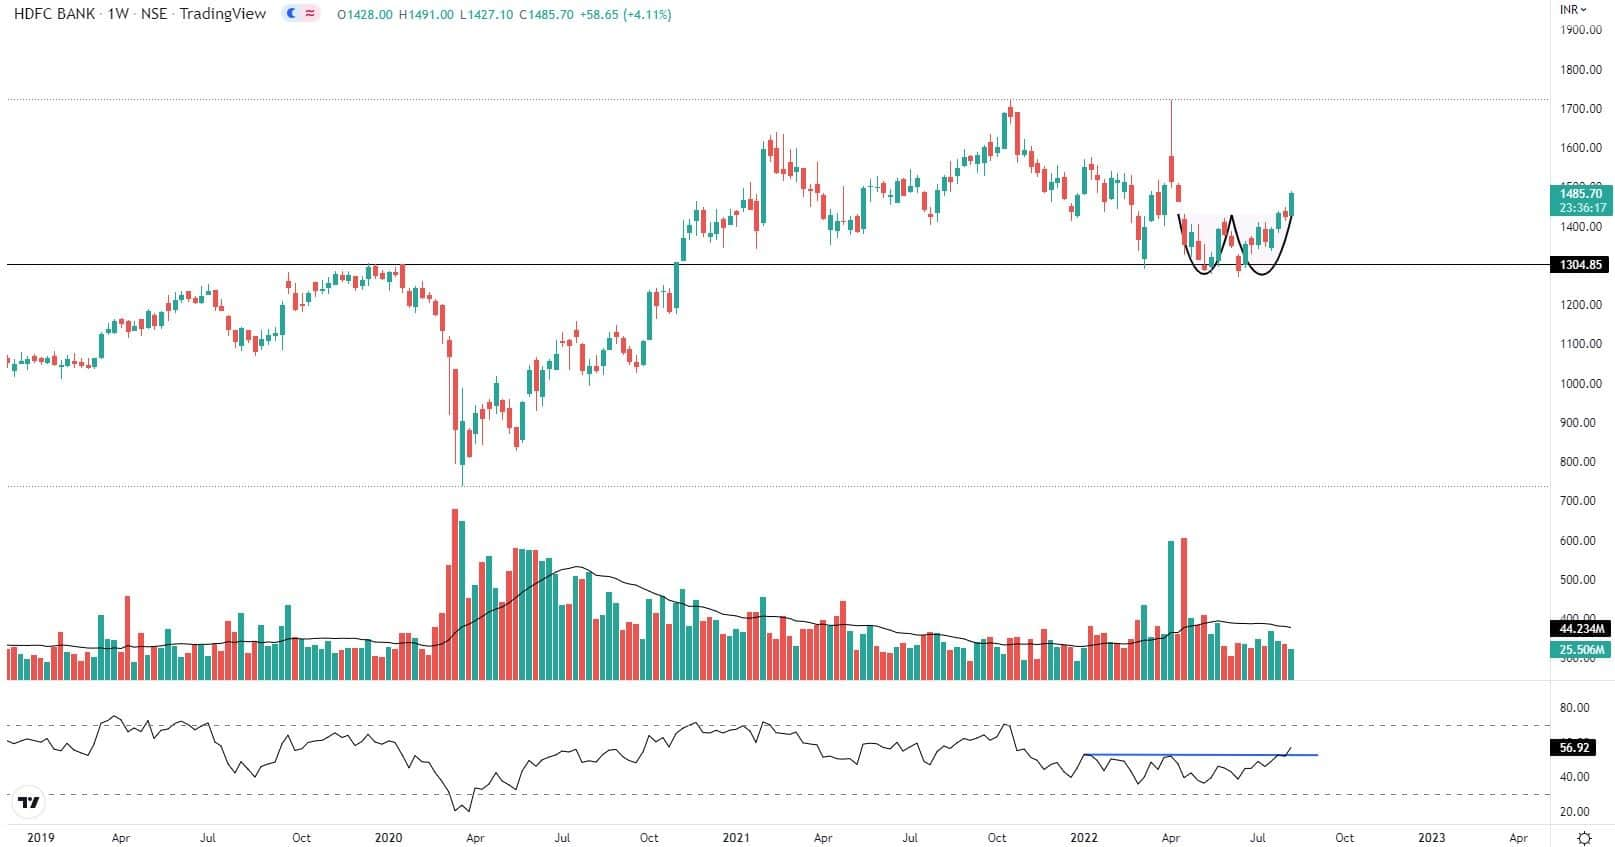
On the weekly chart of HDFC Bank, we can spot that prices have shown a bounce on the upside while taking support from its crucial level around Rs 1,300. At the same level of Rs 1,300, we can also witness a change in the polarity by the prices.
On the daily chart, prices in the last week of July gave a breakout from the Double bottom pattern, which indicates beginning of trend on the upside.
The breakout was accompanied by high volumes and a Gap which confirms the breakout.
Prices sustained above Upper Bollinger band which reflects the increasing volatility of the stock. RSI have given a breakout on weekly timeframe which shows that the stock has a strong momentum in the prices.
Going ahead, we expect the prices to go higher till the level of Rs 1,600 for the stop-loss of Rs 1,400, strictly on the closing basis.
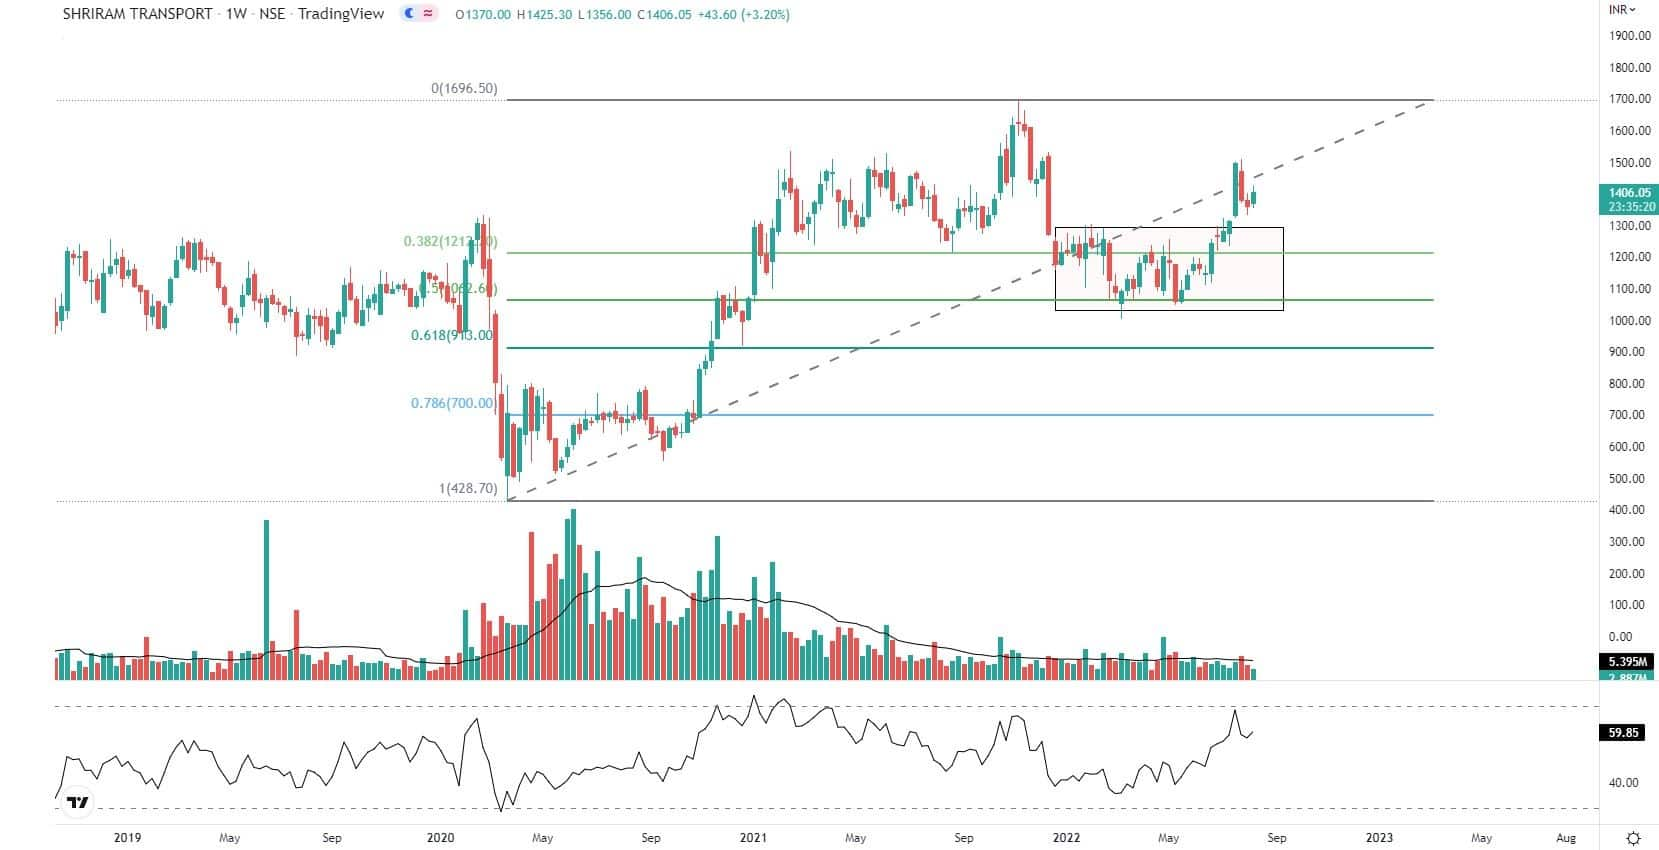
Shriram Transport on weekly timeframe has taken support from 50 percent Fibonacci retracement level from its prior swing of Rs 428.70 (March 2020) level to Rs 1,700 level (November 2021).
Prices in July 2022 gave a breakout from Rectangle pattern which indicates that prices can trend on the upside.
Prices on daily timeframe have started to form higher high, higher low formation, confirming beginning of trend.
Prices on daily timeframe are roaming around the upper Bollinger band, which indicates that the volatility for the upside is rising.
RSI plotted on weekly and daily timeframe are above 50 marks which tells that prices have strong momentum in it.
Going ahead we expect prices to go higher till level of Rs 1,700 for the stop-loss of Rs 1,230 on the closing basis.

Discover the latest Business News, Sensex, and Nifty updates. Obtain Personal Finance insights, tax queries, and expert opinions on Moneycontrol or download the Moneycontrol App to stay updated!
Find the best of Al News in one place, specially curated for you every weekend.
Stay on top of the latest tech trends and biggest startup news.


