Nifty50 seems to have again formed a bullish V shape reversal pattern on the daily chart and prices have successfully closed above the midpoint of the pattern which is positive for the index.
On the February 2, the benchmark index opened with an almost one percent higher tick and traded higher throughout the day without filling its opening gap. A strong surge in prices has made it possible for nifty to close above its 21 & 50 – day exponential moving average and reverse its intermediate negative trend.
A double bottom formation with positive divergence works beautifully for the momentum oscillator RSI (14) on the weekly chart and the oscillator never dipped below 50 levels indicating an intact bullish range shift formation.
A bullish pole flag pattern on the weekly time frame seems to have completed its throwback near 61.80 percent Fibonacci retracement and the uptrend is most likely to stretch the prices further higher.
From here on 17,600 levels will act as immediate support for the Nifty50 and if prices slip below this level then 17,350 will be the next support zone for the index. The upper band is capped near 18,000 levels for the time being.
Bank Nifty has closed above its trend line resistance placed at 38,700 levels and has also crossed above its 61.80 percent Fibonacci retracement which was acting as strong resistance in a previous couple of occasions. The support for the banking index is placed near its previous resistance zone at 38,700 – 38,500 levels and the upper band is capped near 40,500 levels.
Here are two buy calls for next 2-3 weeks:
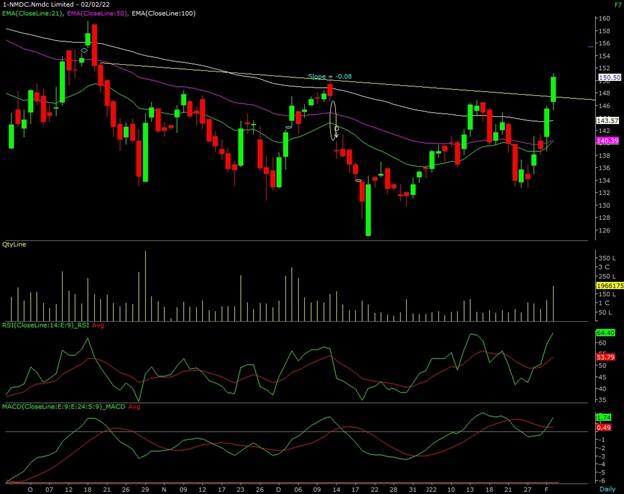
NMDC: Buy | LTP: Rs 150.50 | Stop-Loss: Rs 144 | Target: Rs 162.50 | Return: 8 percent
The prices were trading in an Inverted Head & Shoulder formation for the past three months and have formed a neck line resistance at Rs 146 levels.
NMDC has broken out of an Inverted Head & Shoulder at Rs 148 levels on February 2 and the prices have registered a decisive breakout that suggests a change in the trend from sideways to upside. Stock is trading above its 21, 50 & 100-day exponential moving averages on the daily time frame, which is positive for the prices in the near term.
The MACD (moving average convergence divergence) indicator is reading above its centerline with a positive crossover above its signal line. Momentum oscillator RSI (14) (relative strength index) is reading above 60 levels which indicates positive momentum will like to continue ahead.
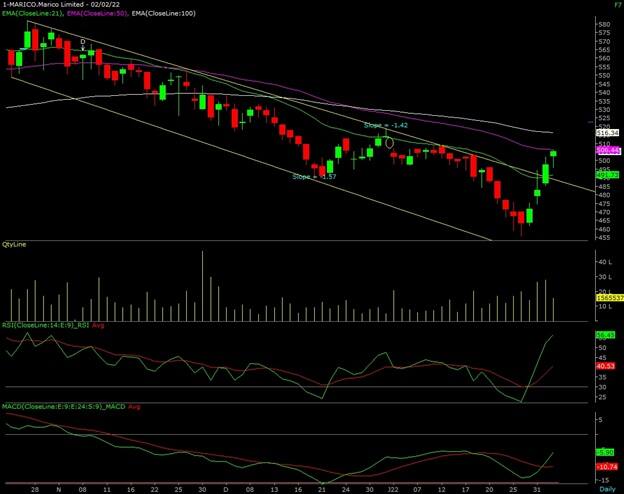
Marico: Buy | LTP: Rs 505.30 | Stop-Loss: Rs 480 | Target: Rs 546 | Return: 8 percent
The Prices are trading in a lower high lower low pattern since past three months and has formed a falling channel pattern on the daily time frame.
Marico has broken out of a falling channel pattern at Rs 497 levels on February 1 and the prices have registered a decisive breakout that suggests a change in the trend from bearish to bullish.
The sharp move on the February 1 has forced their pries to close above its 21-day exponential moving average and has breached its hurdle of downward sloping trend line on the daily interval. Momentum oscillator RSI (14) has witnessed a breakout of a horizontal trend line at 50 levels with positive crossover.
Disclaimer: The views and investment tips expressed by investment experts on Moneycontrol.com are their own and not those of the website or its management. Moneycontrol.com advises users to check with certified experts before taking any investment decisions.

Discover the latest Business News, Sensex, and Nifty updates. Obtain Personal Finance insights, tax queries, and expert opinions on Moneycontrol or download the Moneycontrol App to stay updated!
Find the best of Al News in one place, specially curated for you every weekend.
Stay on top of the latest tech trends and biggest startup news.