


The Nifty advanced for the seventh straight day to log the best stretch of gains in 11 weeks and touched the all-time high of 20,000 points on September 11. The Nifty Midcap and Smallcap indices continued their rally to fresh record highs.
As the Nifty has managed to surpass the previous swing high resistance of 19,991, it has now reached the uncharted territory. The band of 19,800-19,900 now becomes a strong support for the Nifty in the short term. As far as the upside target is concerned, the index is now headed for the level of 20,924, which happens to be the 100 percent Fibonacci extension resistance of the entire swing seen from 15,183 in June 2022 to 18,887 in December 2022, and then to 16,828 in March 2023.
Breadth of the market is very strong as more than 91 percent of the stocks are trading above their 200 DMA in the NSE500 index. This reading is obviously overbought. However, in the second half of 2020 and 2021, we saw this number sustaining above 96 percent.
We have seen fresh breakouts in NSE200 and NSE100 and Nifty indices, which indicate good upside in large-cap stocks. The monthly ratio chart of the Nifty against the Nifty Midcap 100 index has reached the extreme oversold zone and in the history whenever this reading was seen, the Nifty had started outperforming against the Midcap index.
We believe that it is the time to increase the exposure in largecaps and reduce in midcaps. Risk reward does not seem favourable in midcaps and smallcaps.
Here are three buy calls for short term:Bank of Maharashtra: Buy | LTP: Rs 44.30 | Stop-Loss: Rs 41 | Target: Rs 48 | Return: 8 percentThe stock price has broken out from upward sloping trendline on the weekly chart. In the month of July stock broke out from Bullish Inverted Head and Shoulder pattern on long term charts.
In August, stock outperformed the PSU bank index and remained near its 52-week high. Stock is placed above all important moving averages, indicating bullish trend on all time frames. Indicators and oscillators like MACD (moving average convergence divergence) and RSI (relative strength index) have turned on weekly chart.

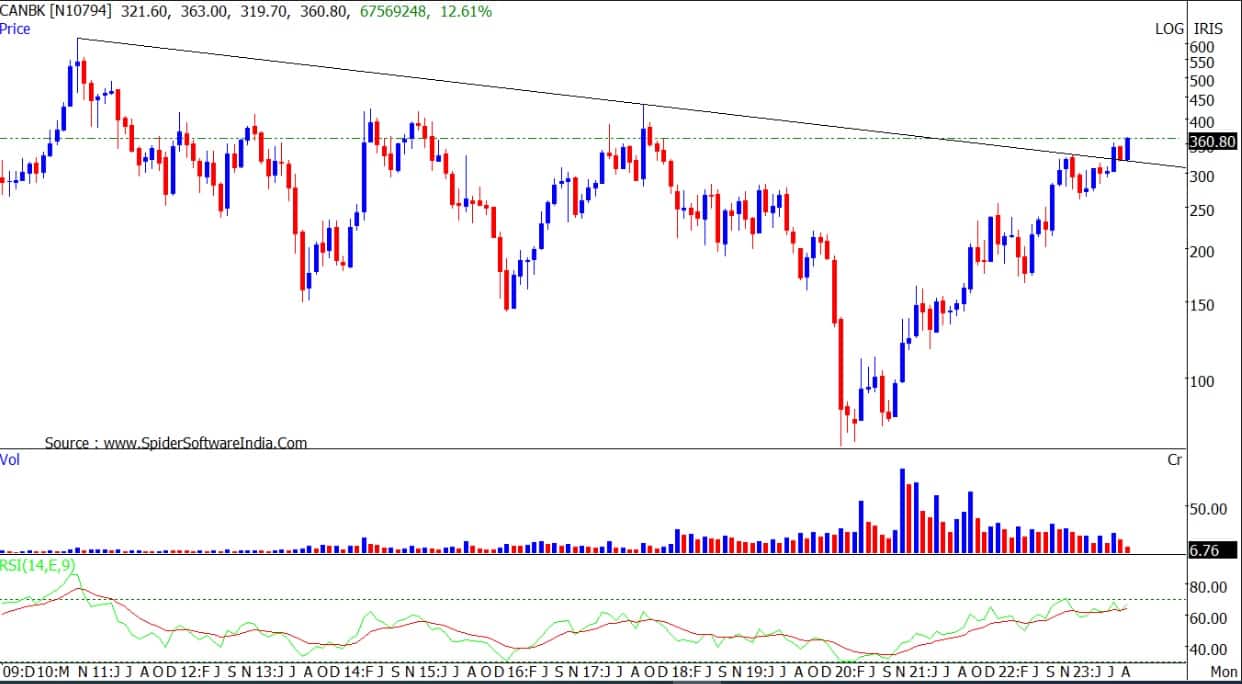
The stock price has broken out from downward sloping trendline on the monthly chart. Price breakout is accompanied with jump in volumes. Stock price is trading above its 20, 50 and 200 DMA, indicating bullish trend on all time frame.
Indicators and Oscillators like MACD and RSI have turned bullish on the monthly charts. Nifty PSU Bank Index has broken out from the consolidation.
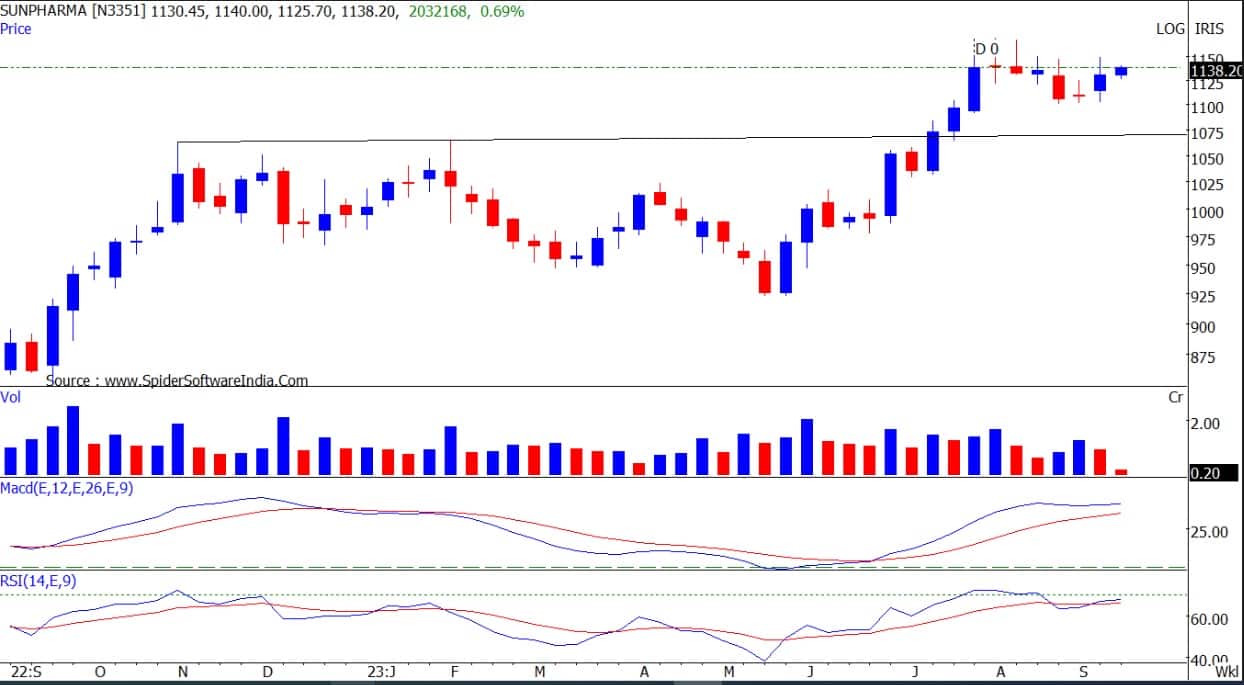
Sun Pharmaceutical Industries has broken out from downward sloping channel on the daily chart. Stock price found support near its 50-day EMA (exponential moving average) and bounced back.
It is trading above its 20, 50 and 200 DMA, indicating bullish trend on all time frame. Indicators and Oscillators like MACD and RSI have turned bullish on the daily charts. Nifty Pharma Index has resumed its primary uptrend.

Discover the latest Business News, Sensex, and Nifty updates. Obtain Personal Finance insights, tax queries, and expert opinions on Moneycontrol or download the Moneycontrol App to stay updated!
Find the best of Al News in one place, specially curated for you every weekend.
Stay on top of the latest tech trends and biggest startup news.


