
The stock of Computer Age Management Services Ltd (CAMS) is on the verge of a breakout, displaying a horizontal trendline breakout pattern on the daily scale. On Wednesday, the stock recorded volumes above the 50-day average, signalling accumulation before the actual breakout. The stock is currently trading above its short and long-term moving averages.
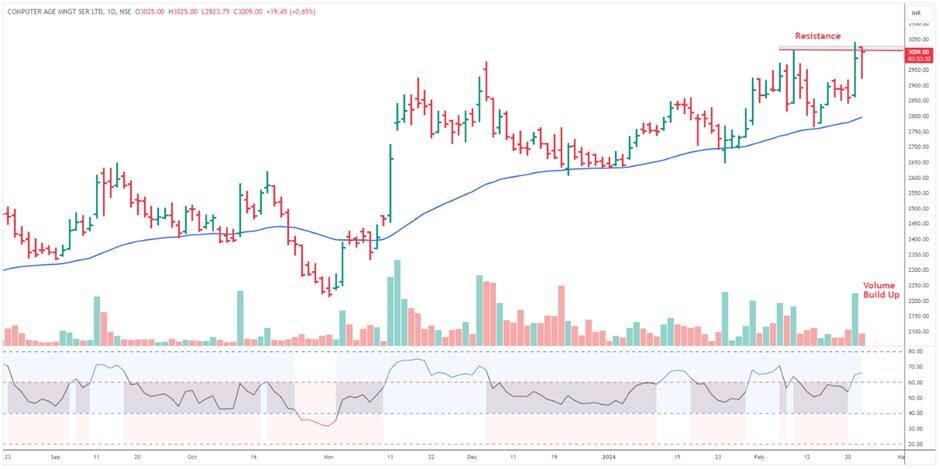 Technical chart of CAMS showing scrip is on verge of horizontal trendline breakout | Source: SBI Securities
"CAMS marked a high of 3,024.95 on February 8, 2024, and thereafter experienced a minor throwback. Interestingly, during this throwback period, volume activity remained mostly below average, and the stock found strong support in the zone of Rs 2,760-2,770, which corresponds to the 50-day EMA zone," Sudeep Shah, DVP and head of derivative and technical research at SBI Securities, said.
Recent performance highlights CAMS outshining the frontline indices. The ratio chart of CAMS in relation to Nifty consistently marks higher highs and higher lows since January 2024. The Mansfield Relative Strength has remained above the zero line for the past 17 trading sessions.
In the recent period, Shah points out that the stock has taken support near the 50-day EMA zone three times, witnessing a smart rebound each time. "Currently, the stock is on the verge of a horizontal trendline breakout on the daily scale. On Wednesday, the stock witnessed volumes above the 50-day average, indicating accumulation before the actual breakout. The stock is trading above its short and long-term moving averages. These averages are in the desired sequence and in a rising trajectory, which is a bullish sign. The daily RSI is in the super bullish zone," added Shah.
Hence, Shah recommends accumulating the stock in the zone of Rs 3020-2990 with a stop loss at Rs 2915. On the upside, it is likely to test the level of Rs 3160, followed by Rs 3220 in the short term.
Disclaimer: The views and investment tips expressed by investment experts on Moneycontrol.com are their own and not those of the website or its management. Moneycontrol.com advises users to check with certified experts before taking any investment decisions.
Discover the latest Business News, Sensex, and Nifty updates. Obtain Personal Finance insights, tax queries, and expert opinions on Moneycontrol or download the Moneycontrol App to stay updated!


