


Dear Reader,
As the war in the Gaza Strip enters the next phase, global financial markets have panicked. The week saw volatility rise in all asset classes. Equity markets fell sharply while bond yields rose in most markets. Gold prices crossed the $2,000 an ounce level during the week, hovering close to its all-time high. Oil prices moved wildly on worries over Iran entering the war.
Foreign investors continued to take shelter by dumping shares in the emerging markets and rushing to park their funds in bonds and gold.
In the Indian equity markets, the fall was more broad-based, with smaller stocks also participating, indicating a risk-off approach by more investors. After most technical indicators touched an oversold level on Thursday, markets got a much-needed breather on Friday when there was a sharp bounce.
The worst may not be over
Several technical indicators signal an oversold market due for a bounce back that can last till Diwali. However, next week will be interesting as the market tries to test the recent low. The only thing that can delay the fall is a sudden change in the geopolitical scenario.
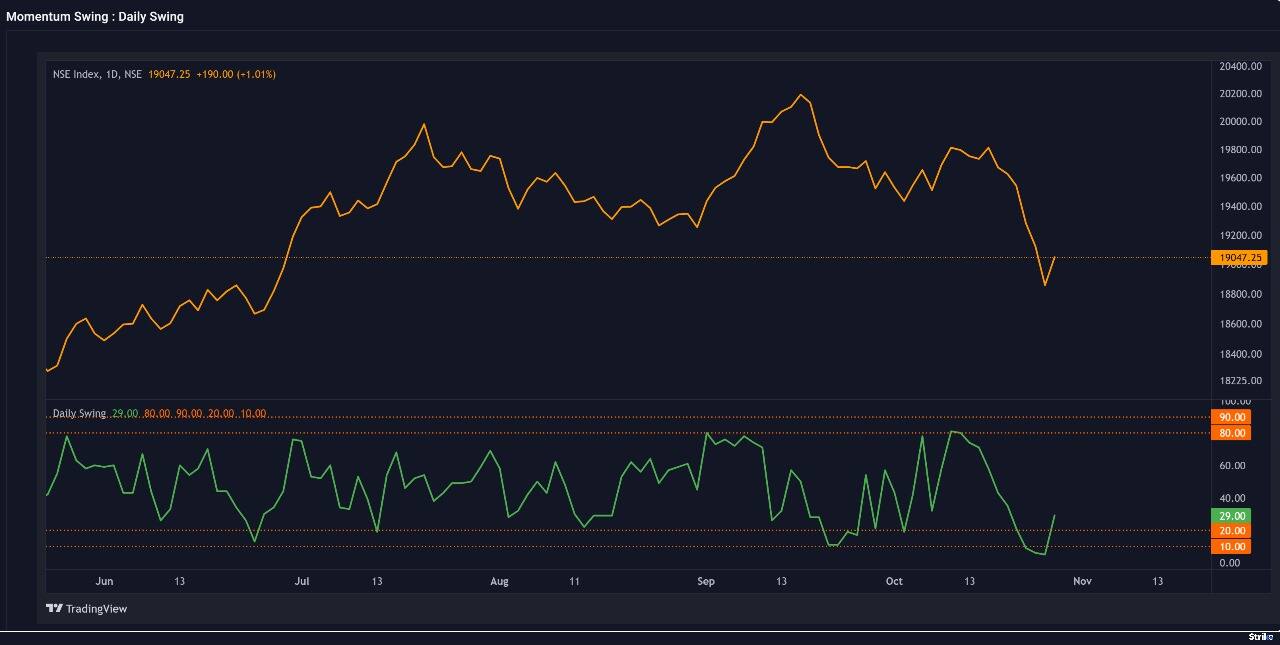
On Thursday this week, the RSI for all indices from Nifty, Bank Nifty, Midcap Index in the Indian market and S&P and Nasdaq in the US markets went below 30 levels and into oversold territory. Though a one-day bounce followed, we must see follow-up buying to be convinced that a temporary bottom has been made.
The daily swing level fell to an extremely oversold level of 5 on Thursday, while the average swing touched 7. When both the swing indicators are in the lower single digits, the market is extremely oversold. However, sometimes a positive divergence develops in momentum indicators before a reversal is confirmed, for which we should be watchful.
 Source: web.strike.money
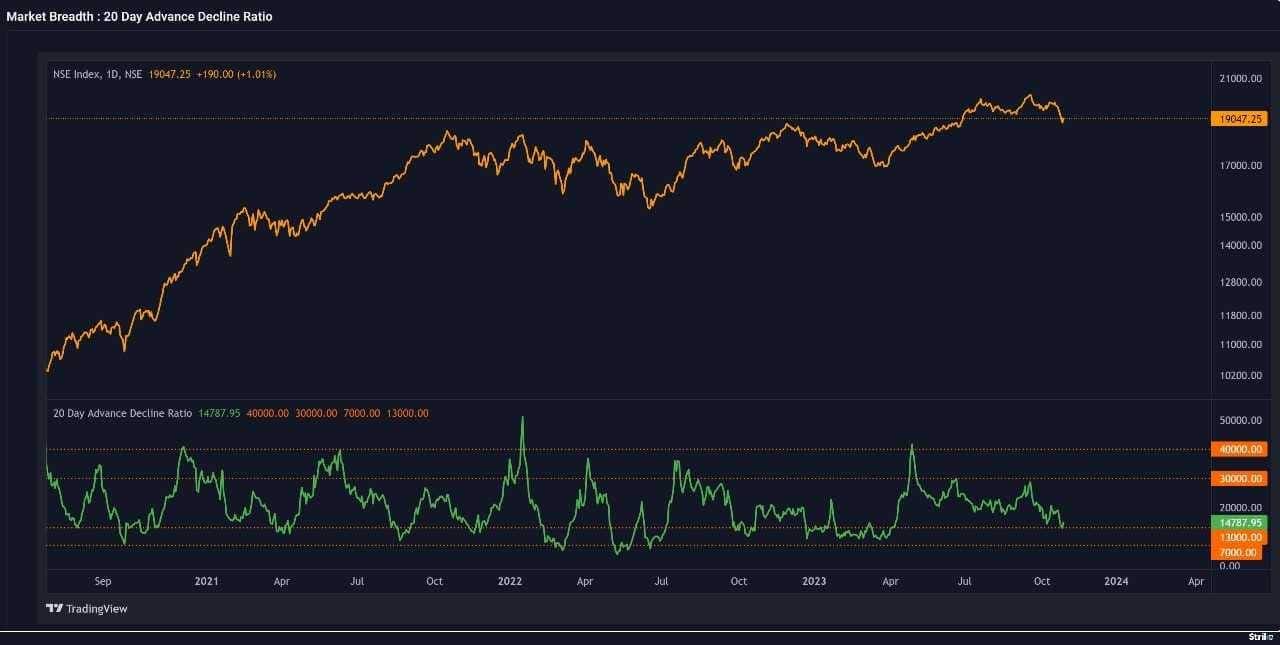
The 20-day average of the advance-decline (A/D) ratio is a good indicator of market internals. It indicates the number of stocks participating in the rally. The 20-day A/D peaked early in this rally, but when we made a new high in September, the ratio was nowhere close to the highs, indicating a negative divergence.
In August, Midcaps and large-caps diverged in a big way, an unusual trend that we have not seen before. It is only now that large mid, and small-cap stocks are all undergoing a simultaneous correction, resulting in the A/D ratio line going below the first red line. The second red line is where we get into very oversold territory.
Usually, after a big rally, we can expect the market correction to come down to the second red line, but only future price action in the coming weeks will decide if this level is touched.
 Source: web.strike.money
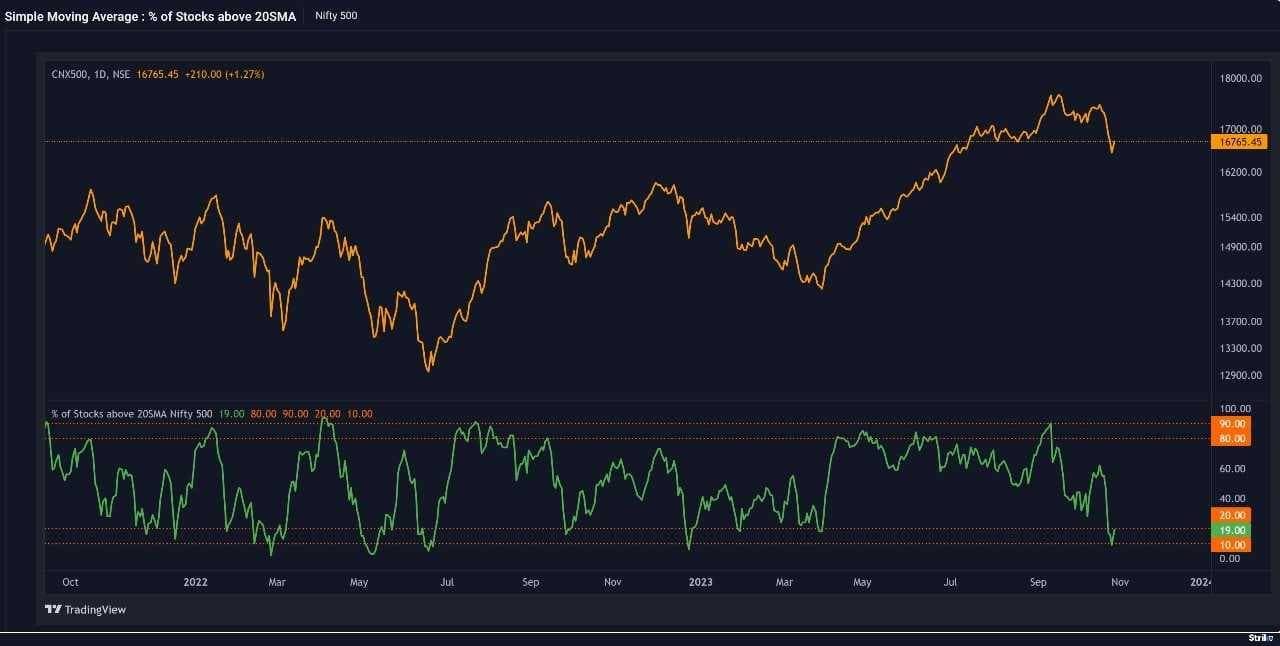
As mentioned earlier, the fall was broad-based. The number of Nifty 500 stocks below the 20dma reached an oversold extreme. The indicator below went to the lower red line and became oversold. Over the next few days and weeks, we must closely watch for a trend reversal.
 Source: web.strike.money
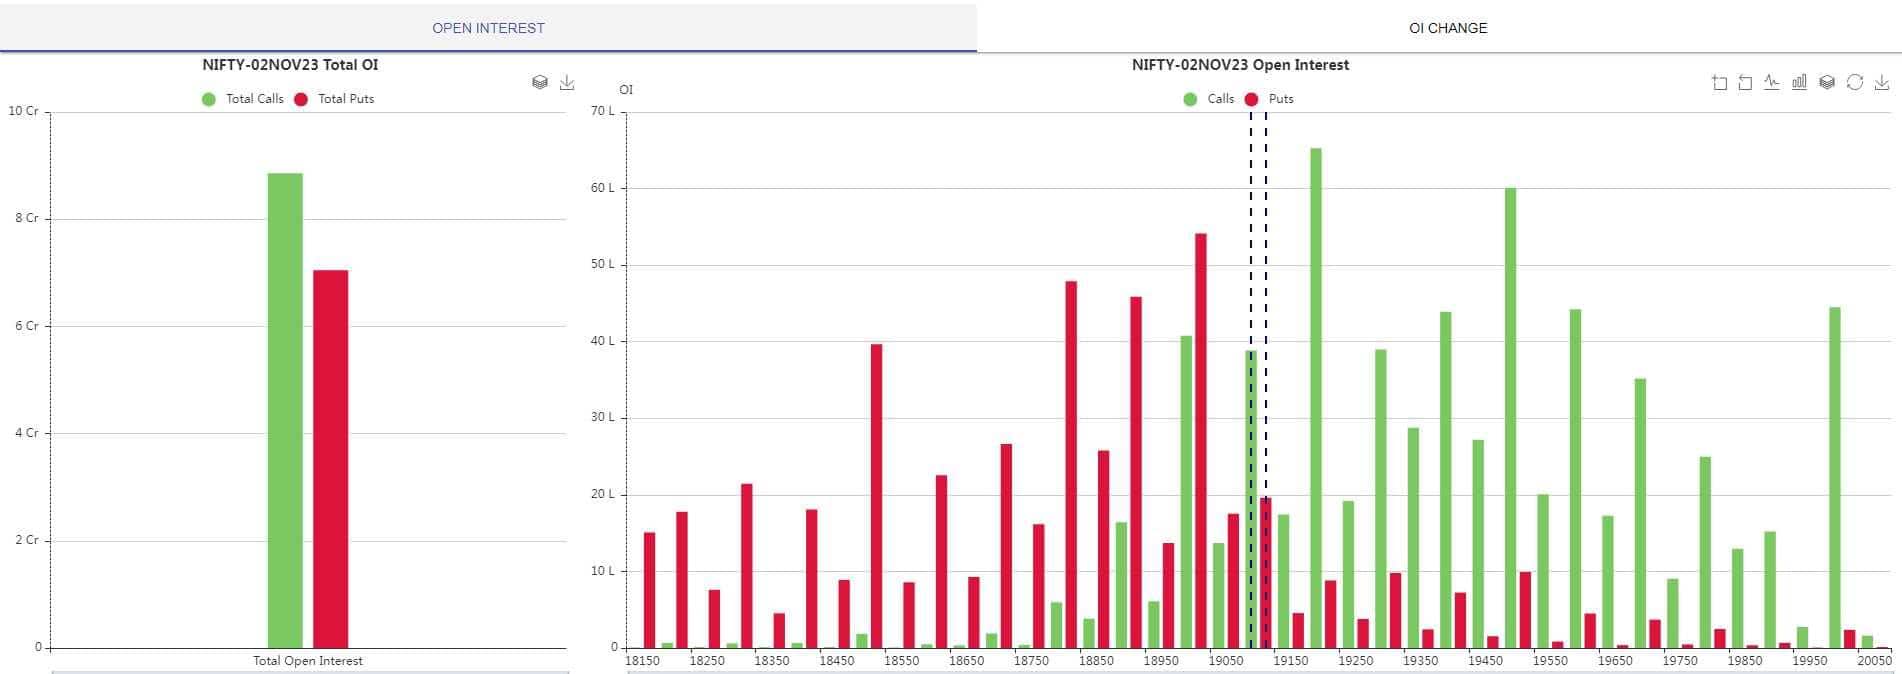
Options Data
Options data also shows more call writers in the market than put writers for the November 02 expiry. Despite a sharp rally on Friday, which saw Put writers add to their position, the overall strength continues to be in the hands of call writers.
 Source: Icharts.in
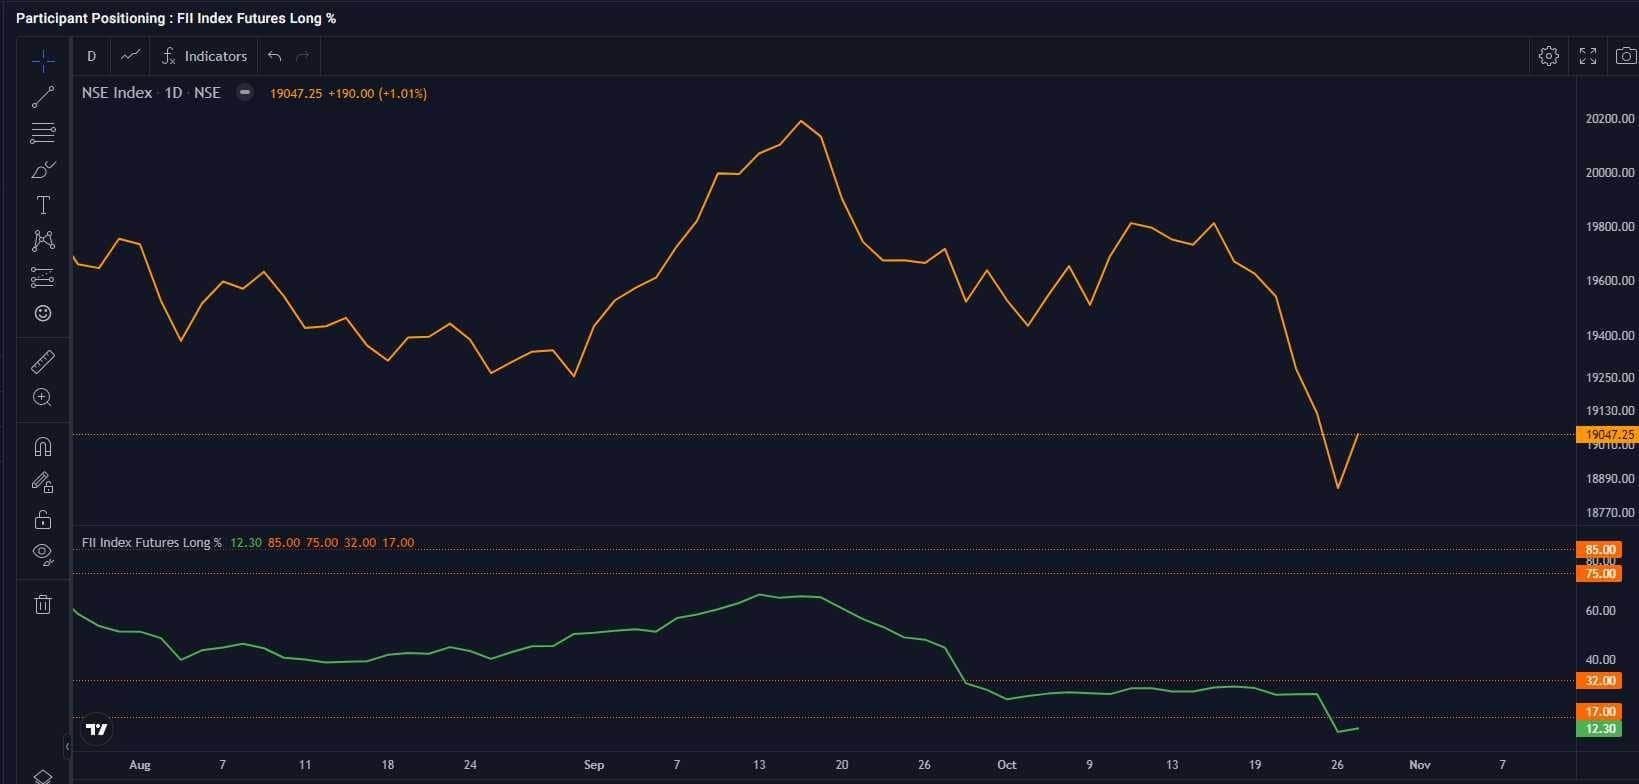
FIIs continue to sell
Foreign investors continue to sell in the cash market, with sales of Rs 13,187 crore during the week and taking the monthly sales level to Rs 26,598.73 crore.
Interestingly, the sharp rally on Friday did not see appreciable short covering by FPIs. The net long position by FPIs is only 12.30 percent of their overall position, marginally higher from a low of 10.88 percent the previous day. Data indicates that FPIs are expecting the market to fall further.
 Source: web.strike.money
Indices and Market Breadth
During the week, Sensex fell 2.46 percent while Nifty50 dropped by 2.53 percent. The BSE Small-cap, BSE Mid-cap and Large-cap indices dropped 3.4 percent, 2.4 percent and 2.5 percent, respectively.
During the week, all sectoral indices saw losses, with Media and Metals taking it on the chin.
Despite the fall, some frontline stocks posted gains, which included Axis Bank, Coal India, and HCL Tech. The top losers during the week were UPL, Adani Enterprises, and JSW Steel.
Among the smaller stocks, Black Box gained 20.64, Sadhana Nitrochem was up 18.4 percent, while Swan Energy closed 17.93 percent higher. Among the losers were MMTC, which fell 18.47 percent, Sterlite Technologies falling 17.85 percent and Ion Exchange by 16.72 percent.
Global Markets
Global markets were trading in the red. Besides the geopolitical development, corporate results have also impacted market sentiment. Earnings of Google and Facebook were below expectations, while those of Microsoft, Intel and Amazon were better than expected. A better than expected GDP number also gave markets reasons to worry as these numbers would make the Fed delay cutting interest rates.
All European markets were in the red, with the pan-European Stoxx 600 losing 0.96 percent, CAC and DAX closing nearly 0.75 percent lower, and FTSE falling the most by 1.55 percent.
In Asian markets, Nikkei fell by 1.36 percent, but Chinese markets and Hang Seng closed higher after profits of industrial firms in China rose for the second straight month, well above expectations.
Stocks to Watch
Because of the overall negative sentiment in the market, there are just a handful of stocks that are showing strength. These include Bajaj Auto, IPCA, Nestle, HCL Tech, Powergrid, Trent, TVS Motor and Persistent Systems.
Among the stocks offering a good risk-reward ratio are Asian Paints, Ambuja Cements, HDFC Bank, HUL, ITC, TCS and Balkrishna Industries.
Cheers, Shishir Asthana

Discover the latest Business News, Sensex, and Nifty updates. Obtain Personal Finance insights, tax queries, and expert opinions on Moneycontrol or download the Moneycontrol App to stay updated!
Find the best of Al News in one place, specially curated for you every weekend.
Stay on top of the latest tech trends and biggest startup news.


