


The market rebounded smartly by breaking out a bullish flag pattern formation on April 24 and closed with seven-tenth of a percent gains, led by buying in banking and financial services, FMCG and technology stocks.
The BSE Sensex jumped over 400 points to 60,056, while the Nifty50 closed above the crucial resistance of 17,700, climbing nearly 120 points to 17,743.
Bank Nifty has also seen a breakout of bullish flag formation on the daily scale and closed above 42,600 levels with more than 500 points.
The northward journey was also seen in broader markets as the Nifty Midcap 100 index gained 0.4 percent and Smallcap 100 index was up 0.7 percent.
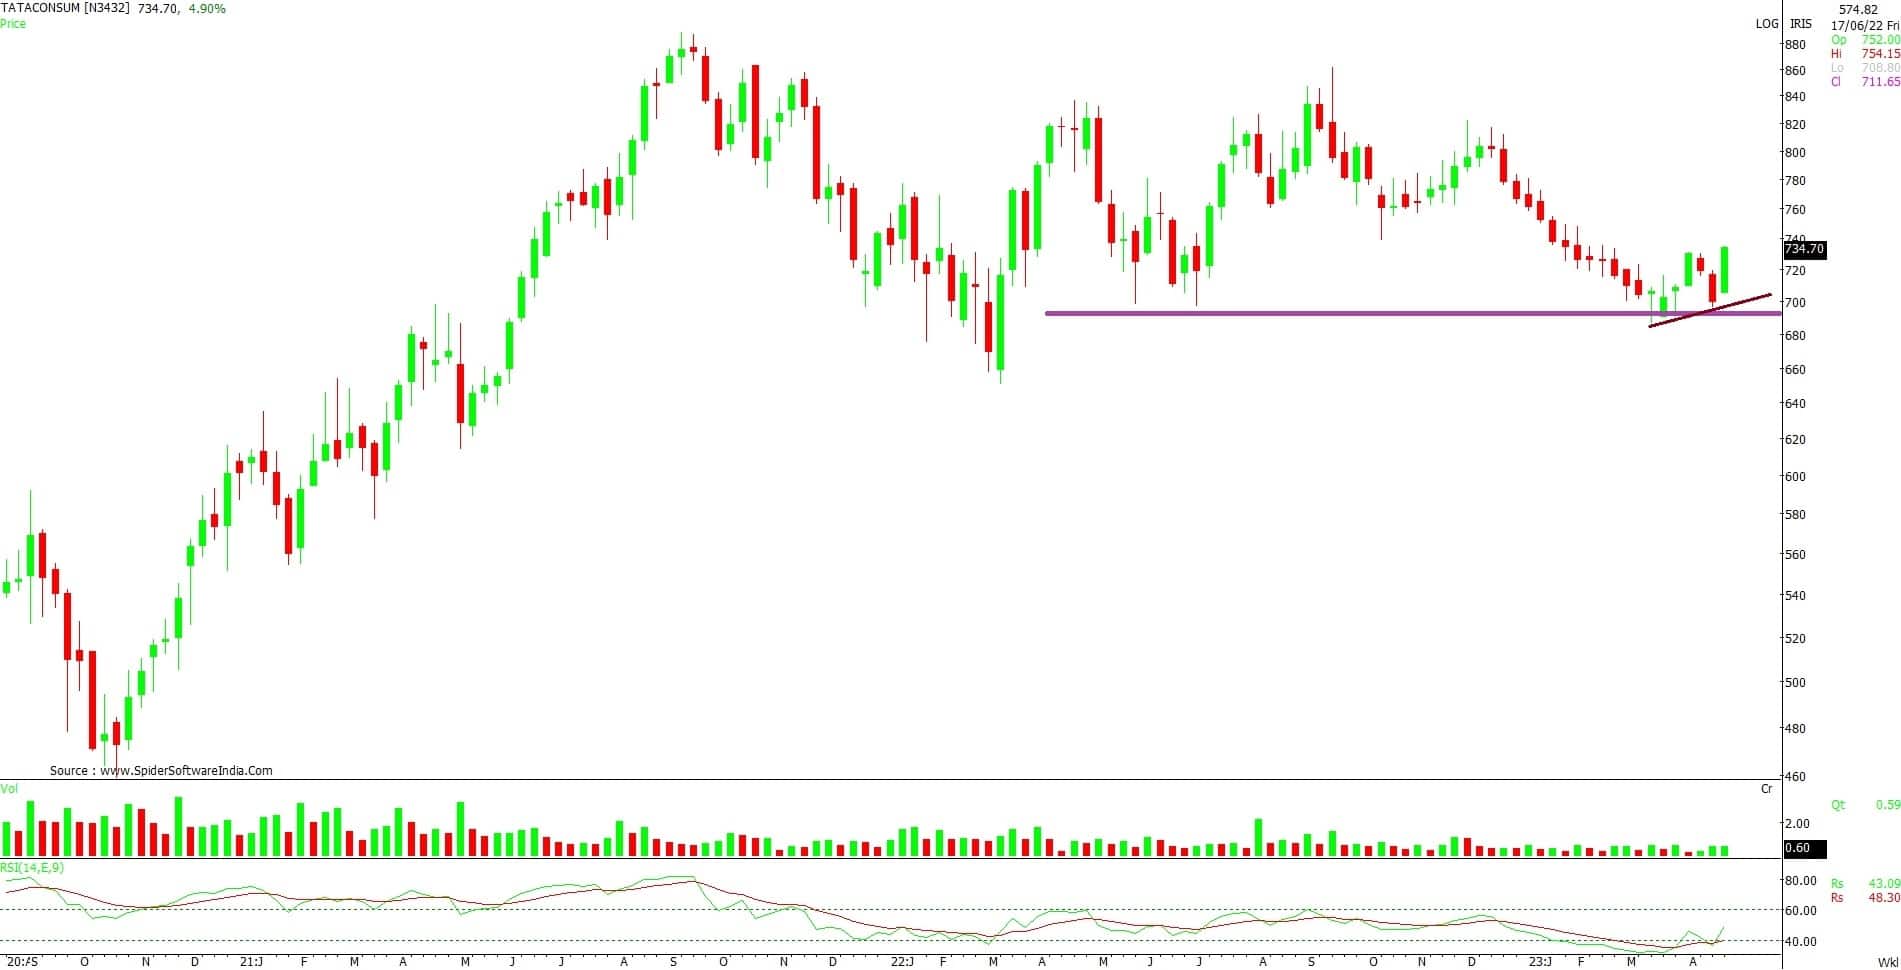
Stocks that performed better than broader markets included Tata Consumer Products which jumped 4.6 percent to Rs 732.5, the highest closing level since February 16. The stock has formed large bullish candlestick pattern on the daily charts with robust volumes, with getting back above 50-day EMA (exponential moving average).


IDFC First Bank has seen a range breakout and formed long bullish candle on the daily timeframe with above average volumes. The stock rose over 3 percent to Rs 58, the highest closing level since February 9 and traded above all key moving averages (21, 50, 100 and 200-day EMA).
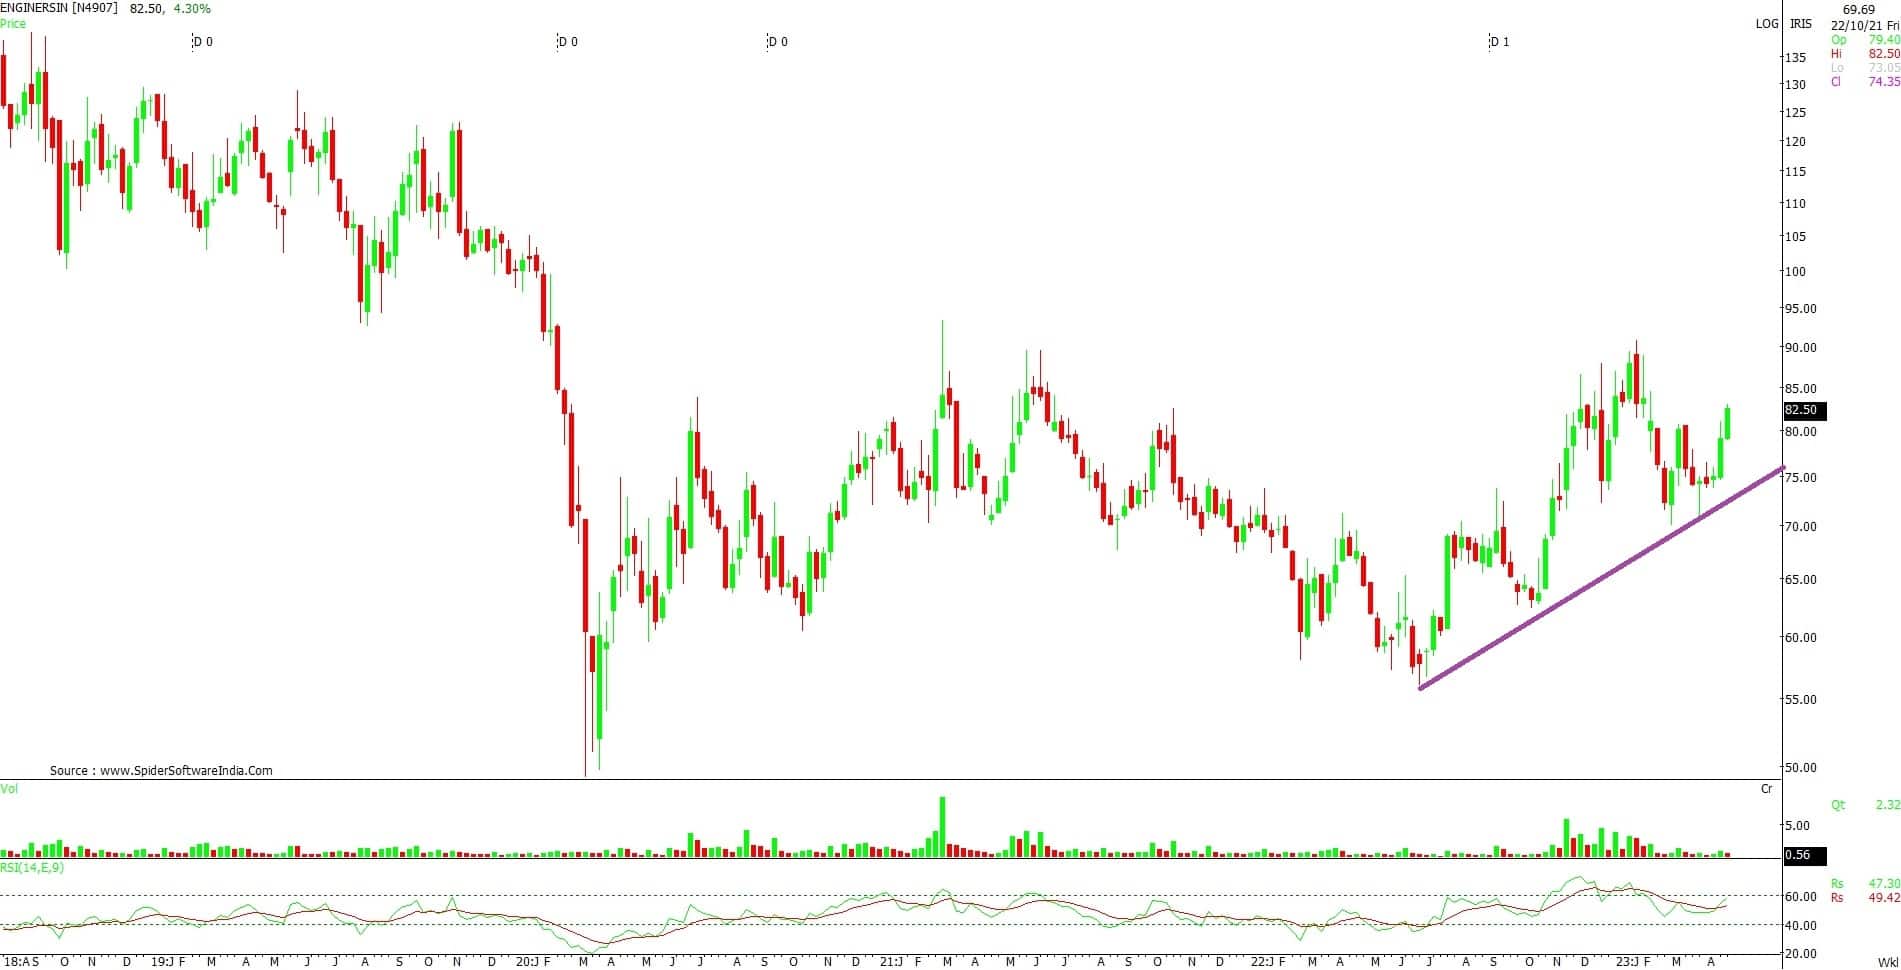
Engineers India climbed over 4 percent to Rs 82.60, the highest closing level since February 8 and formed Bullish Engulfing sort of candlestick pattern on the daily scale with above average volumes. The stock traded above all key moving averages.
Here's what Vidnyan Sawant of GEPL Capital recommends investors should do with these stocks when the market resumes trading today:
The stock has formed CIP (Change in Polarity) and bottomed out near Rs 52 levels and bounced back with the formation of higher top higher bottom pattern indicating bullish undertone of the stock.
On the weekly charts, the stock is giving Descending Triangle pattern breakout with volume confirmation.
On the lower time frame like daily, the stock is giving Cup & Handle pattern breakout which confirms positive strength of the stock.
Breakout from the RSI (relative strength index) reflects rising momentum in the prices for an up move.
We recommend traders and investors to buy and accumulate this stock for the target of Rs 68 with a stop-loss of Rs 54 on the closing basis.

The stock has been respecting an upward slopping trend line on the weekly charts since June 2022 and moving upward indicating bullish structure of the stock.
On the daily charts, the stock has formed CIP (Change in Polarity) pattern at Rs 70 level and moved up.
On April 24, the stock has given breakout of Cup & Handle pattern breakout with volume confirmation.
The stock is trading above its important moving averages like 50, 100 & 200-day SMA (simple moving average) which confirms positive undertone of the stock.
The relative strength index (RSI) on the daily timeframe has sustained well above 65 mark reflecting presence of bullish momentum.
We recommend traders and investors to buy and accumulate this stock for the target of Rs 98 with a stop-loss of Rs 77 on the closing basis.
The stock made a life time high at Rs 889 level in September 2021 after that it moved in a correction phase, however the stock gave a shallow correction of 23.6 percent retracement of previous advance from Rs 177 (February 2019) to Rs 889 (September 2021). And now also the stock respecting same support level and moved up above its previous month’s high indicating bullish undertone of the stock.
On the weekly charts the stock is giving breakout of A-B-C pattern near support zone of Rs 700 level.
On the daily charts, the stock has formed Bullish Kicker candle pattern with huge volume confirmation which shows strong demand at lower levels.
The RSI on the daily timeframe is closed above 60 level with higher top higher bottom pattern reflecting presence of positive momentum.
We recommend traders and investors to buy this stock for the target of Rs 795 with a stop-loss of Rs 700.
Disclaimer: The views and investment tips expressed by investment experts on Moneycontrol.com are their own and not those of the website or its management. Moneycontrol.com advises users to check with certified experts before taking any investment decisions.
Discover the latest Business News, Sensex, and Nifty updates. Obtain Personal Finance insights, tax queries, and expert opinions on Moneycontrol or download the Moneycontrol App to stay updated!
Find the best of Al News in one place, specially curated for you every weekend.
Stay on top of the latest tech trends and biggest startup news.


