The market reversed some losses after three-day gains, led by profit taking after the Fed's hawkish commentary, but maintained higher highs formation for third consecutive session on June 15. Banking & financial services, and technology stocks played key role in downtrend.
The BSE Sensex dropped over 300 points to 62,918, and the Nifty50 slipped 68 points to 18,688, but the broader markets sustained uptrend for four days in a row, rising around 0.2 percent, though the breadth tilted in favour of bears.
Bank Nifty corrected more than 500 points to 43,444, falling below the crucial support level of 43,700 levels.
Stocks that played outperformance on Thursday included Godrej Properties, Apollo Hospitals Enterprises, and Avenue Supermarts. Godrej Properties rallied over 4 percent to Rs 1,589, the highest closing level since May 2, forming long bullish candlestick pattern on the daily charts with robust volumes. It has given a golden crossover in last week of May with 50-day EMA (exponential moving average) crossing 200-day EMA.
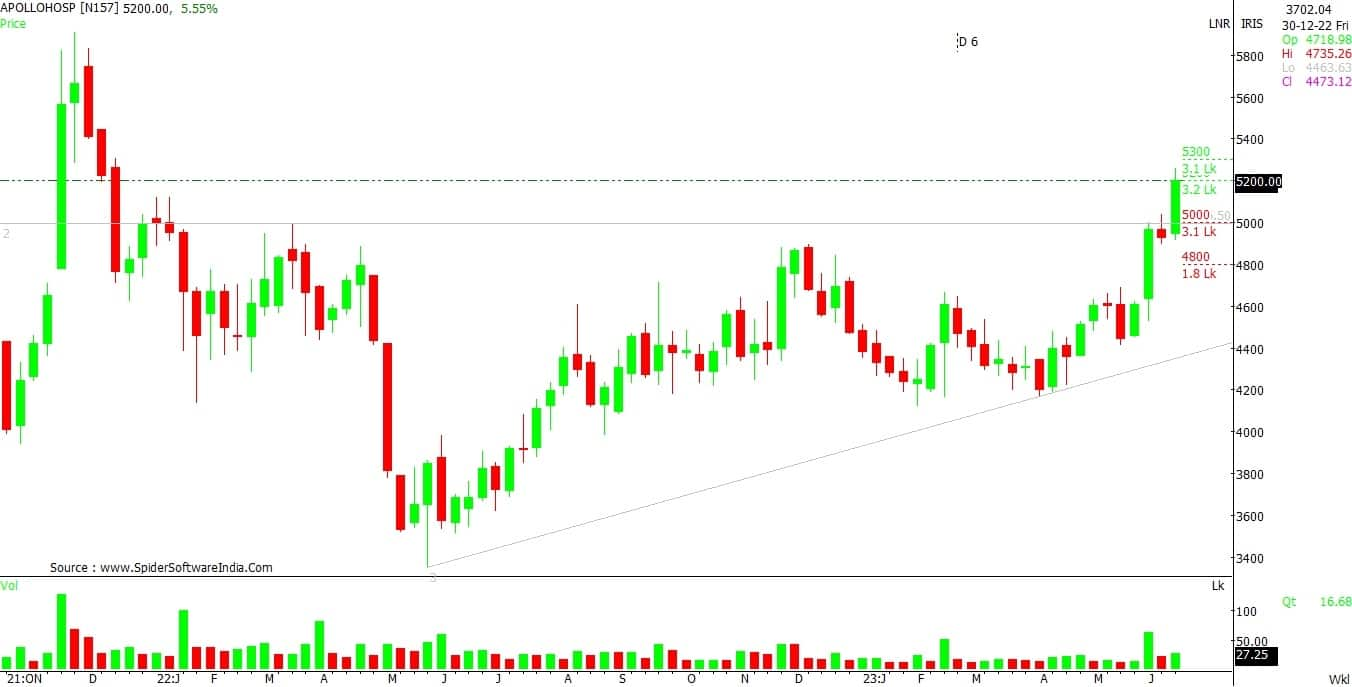
Apollo Hospitals Enterprises has given a healthy breakout of eight-day consolidation and formed strong bullish candlestick pattern on the daily scale with significantly higher volumes. Also there was a big breakout of long downward sloping resistance trendline adjoining highs of November 26, 2021, and June 7, 2023, which is a positive sign. The stock gained over 4 percent to Rs 5,219.
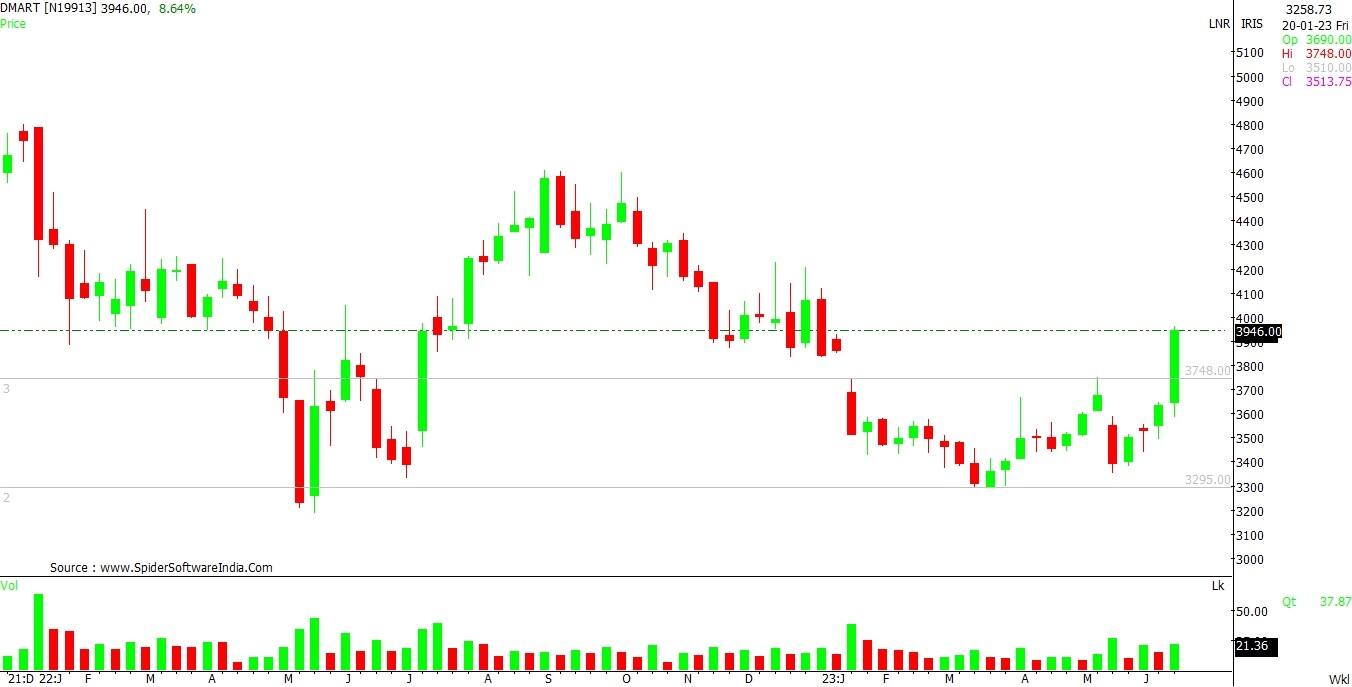
Avenue Supermarts has seen a strong gap up opening and closing with 5.75 percent gains at Rs 3,918. The stock has formed robust bullish candlestick pattern on the daily scale with healthy volumes. It has seen a breakout of horizontal resistance trendline in the initial trade itself on Thursday.
Here's what Shrikant Chouhan of Kotak Securities recommends investors should do with these stocks when the market resumes trading today:
The stock has given a breakout of its Ascending Triangle chart pattern with a strong bullish candlestick on the weekly scale. Additionally, it has formed a higher bottom formation on the daily charts, hence the structure of the stock indicates the beginning of a new up move from the current levels.
For positional traders, Rs 5,000 would be the trend decider level. Trading above the same uptrend formation will continue till Rs 5,550. However, if it closes below Rs 5,000, traders may prefer to exit from trading long positions.
After short-term correction from the higher levels, the counter was in the accumulation zone where it was trading in a rectangle formation. However, on the weekly charts there is a range breakout in the counter along with decent volume activity, which suggest a new leg of bullish trend in the near term.
Unless it is trading below Rs 3,800, positional traders can retain an optimistic stance and look for a target of Rs 4,250.

Despite weak market sentiment, the stock held the positive momentum throughout the day on Thursday. The texture of the stock is still in to the positive side but due to temporary overbought conditions, we could see some profit booking at higher levels.
For the trend following traders now, Rs 1,520 would be the key support level to watch out, above which the bullish wave is likely to continue. Above the same, the stock could rally till Rs 1,625-1,650.
On the flip side, a quick short term correction possible if it succeeds to trade below Rs 1,520. Below the same, it could retest the level of Rs 1,480-1,460.

Disclaimer: The views and investment tips expressed by investment experts on Moneycontrol.com are their own and not those of the website or its management. Moneycontrol.com advises users to check with certified experts before taking any investment decisions.
Discover the latest Business News, Sensex, and Nifty updates. Obtain Personal Finance insights, tax queries, and expert opinions on Moneycontrol or download the Moneycontrol App to stay updated!