


The benchmark indices fell seven-tenths of a percent on June 13, extending their downtrend for the second consecutive session following weak global cues. The market breadth was negative, with about 1,743 shares declining compared to 849 advancing shares on the NSE. The market is expected to remain cautious and continue consolidating in the upcoming sessions. Below are some short-term trading ideas to consider:
Rajesh Palviya, Senior Vice President Research (Head Technical Derivatives) at Axis Securities
Shipping Corporation of India | CMP: Rs 227
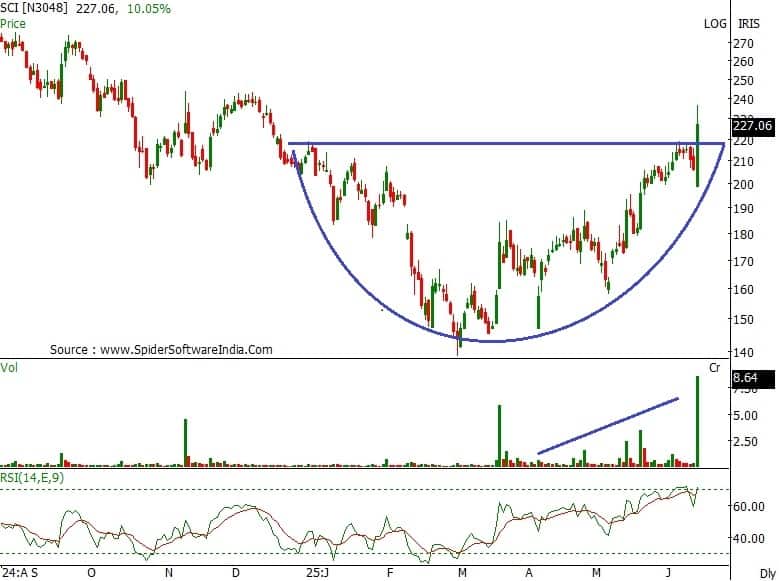
On the daily chart, Shipping Corporation has decisively surpassed the “rounding bottom” formation on a closing basis at Rs 219. This breakout is accompanied by strong volumes, indicating increased participation. The stock is currently sustaining above its 20-, 50-, 100-, and 200-day SMAs, reaffirming bullish sentiment. The daily, weekly, and monthly RSI indicators show rising strength, and a weekly Bollinger Bands buy signal suggests increasing momentum. Investors should consider buying, holding, and accumulating this stock.
Strategy: Buy
Target: Rs 260, Rs 280
Stop-Loss: Rs 219
Narayana Hrudayalaya | CMP: Rs 1,913

Narayana Hrudayalaya is in a strong uptrend, forming a series of higher tops and bottoms across all time frames. On the weekly chart, it has confirmed a “flag” continuation pattern breakout on a closing basis. Rising volumes further confirm increased market participation. It is also trading above its 20-, 50-, 100-, and 200-day SMAs, which are all moving higher along with the price—reinforcing the bullish outlook. A daily Bollinger Bands buy signal indicates strengthening momentum. Investors should consider buying, holding, and accumulating this stock.
Strategy: Buy
Target: Rs 2,050, Rs 2,220
Stop-Loss: Rs 1,790
Manappuram Finance | CMP: Rs 280
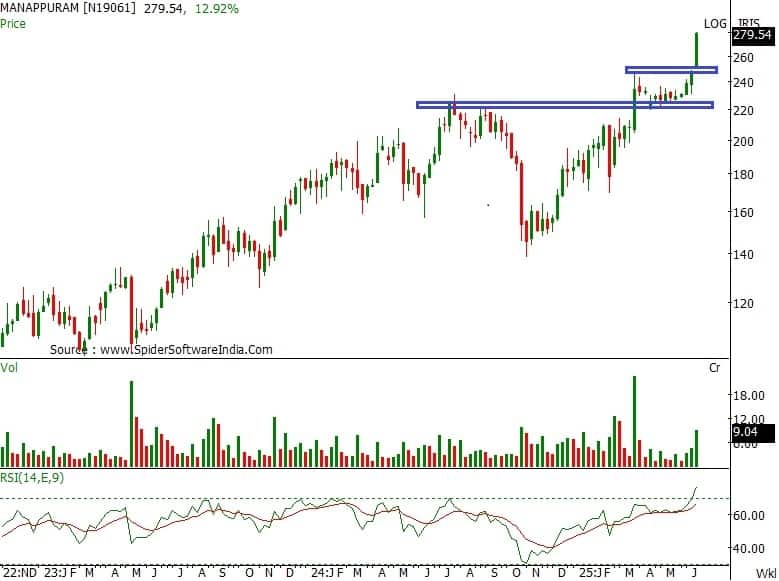
Manappuram Finance is in a strong uptrend, consistently forming higher tops and bottoms on multiple time frames. Both the daily and weekly Bollinger Bands have triggered buy signals, pointing to increasing momentum. The past three weeks of rising volumes reflect growing participation. Currently, the stock is trading well above its major breakout zone of Rs 224. The RSI on daily, weekly, and monthly charts also indicates growing strength. Investors should consider buying, holding, and accumulating this stock.
Strategy: Buy
Target: Rs 296, Rs 313
Stop-Loss: Rs 264
Rajesh Bhosale, Technical Analyst at Angel One
Max Healthcare Institute | CMP: Rs 1,233

After consolidating in a tight range since December, Max Healthcare broke out of a 6-month consolidation pattern last week, posting its strongest weekly close and entering uncharted territory. The breakout is supported by strong volumes and a bullish candlestick formation. With momentum picking up, as indicated by the RSI oscillator, the uptrend is likely to continue. Hence, buy the stock around Rs 1,233 – Rs 1,225 for the near term.
Strategy: Buy
Target: Rs 1,310
Stop-Loss: Rs 1,189
Sigachi Industries | CMP: Rs 58.43

Sigachi Industries has witnessed a remarkable rally of over 30% since the beginning of June, from a recent low of Rs 42. This upward move has been supported by robust trading volumes, reinforcing bullish sentiment. The stock has closed above the December swing high, confirming a saucer pattern breakout on the daily chart—a classic bullish continuation setup. Additionally, the weekly RSI has crossed above the 60 mark, typically signaling a positive shift in medium-term momentum. Buy the stock around Rs 58.5 – Rs 57.5.
Strategy: Buy
Target: Rs 64.5
Stop-Loss: Rs 55.2
Ramco Cements | CMP: Rs 1,062.55
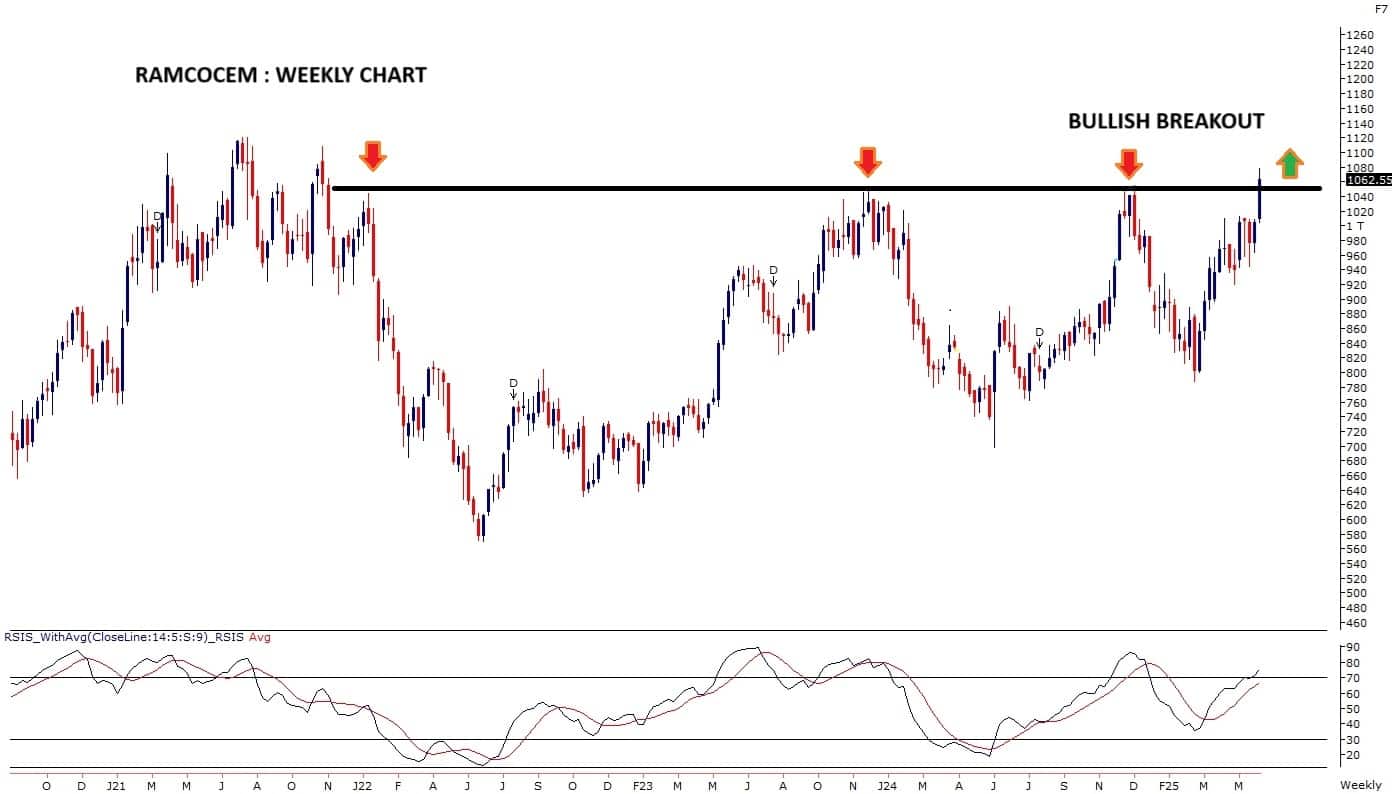
After facing multiple hurdles around the Rs 1,040 level over the past three years, Ramco Cements has finally achieved a multi-year breakout last week. The breakout is confirmed by strong volumes and a bullish candlestick formation. A Golden Crossover (medium-term moving average crossing above long-term average) further strengthens the bullish view. Momentum oscillators are positively aligned. Buy the stock around Rs 1,062 – Rs 1,055.
Strategy: Buy
Target: Rs 1,175
Stop-Loss: Rs 1,005
Anshul Jain, Head of Research at Lakshmishree Investments
Persistent Systems | CMP: Rs 5,882.5

Persistent is forming a 75-day-long cup and handle pattern, with multiple institutional accumulation candles visible within the base. Friday’s session showed signs of a pre-emptive breakout. A sustained move above Rs 5,970 with above-average volumes will confirm a bullish breakout and initiate a fresh uptrend. The stock is expected to retest its all-time high of Rs 6,750. This structure suggests a high-probability institutional setup, ideal for momentum and positional traders.
Strategy: Buy
Target: Rs 6,100
Stop-Loss: Rs 5,800
L&T Finance | CMP: Rs 185.7
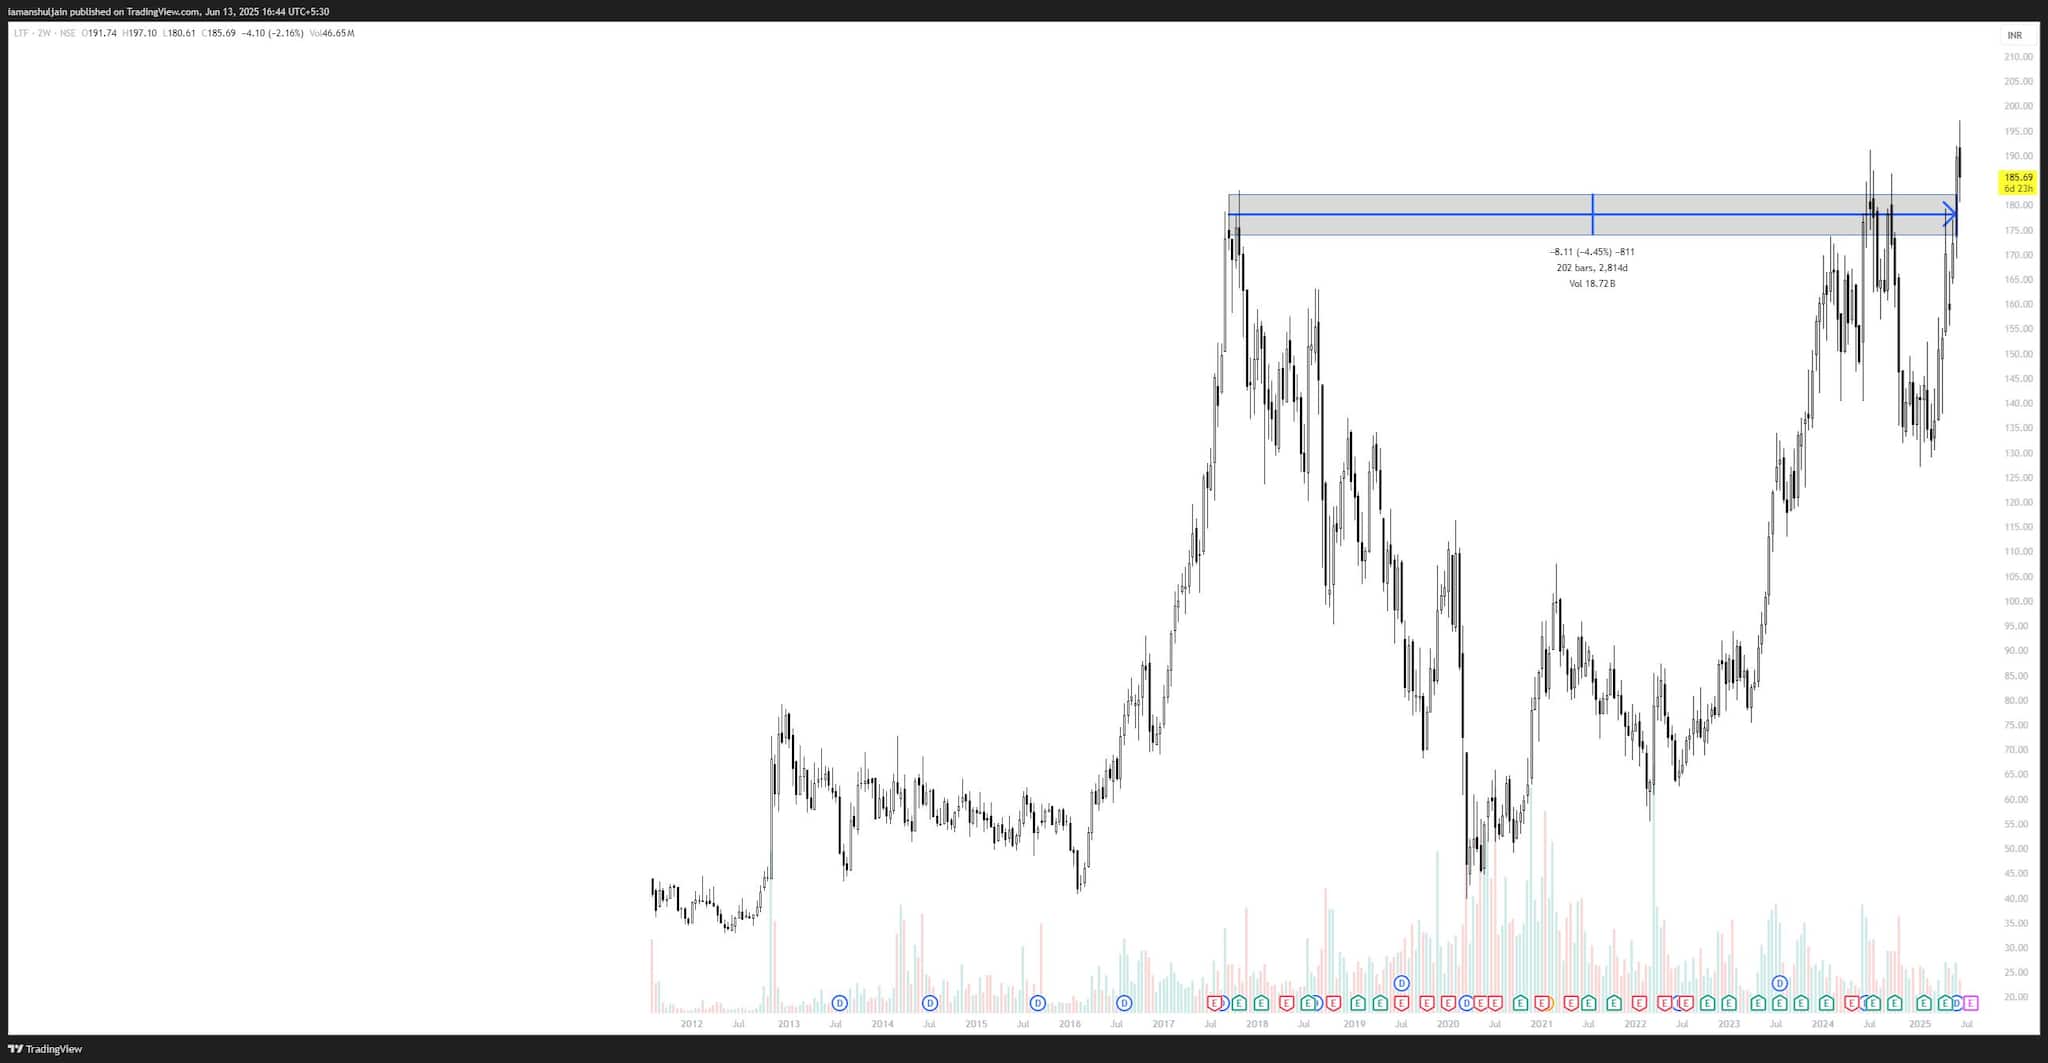
L&T Finance broke out of a 202-week-long cup and handle pattern at Rs 185, supported by strong institutional accumulation at the base. The stock is now sustaining above the breakout level, indicating bullish conviction. However, due to stretched weekly moving averages, a 3–4 week consolidation is likely to allow averages to catch up. Once this consolidation matures, the breakout structure could propel the stock toward Rs 300, making it a compelling buy on dips.
Strategy: Buy
Target: Rs 225
Stop-Loss: Rs 160
SBI Cards and Payment Services | CMP: Rs 1,007
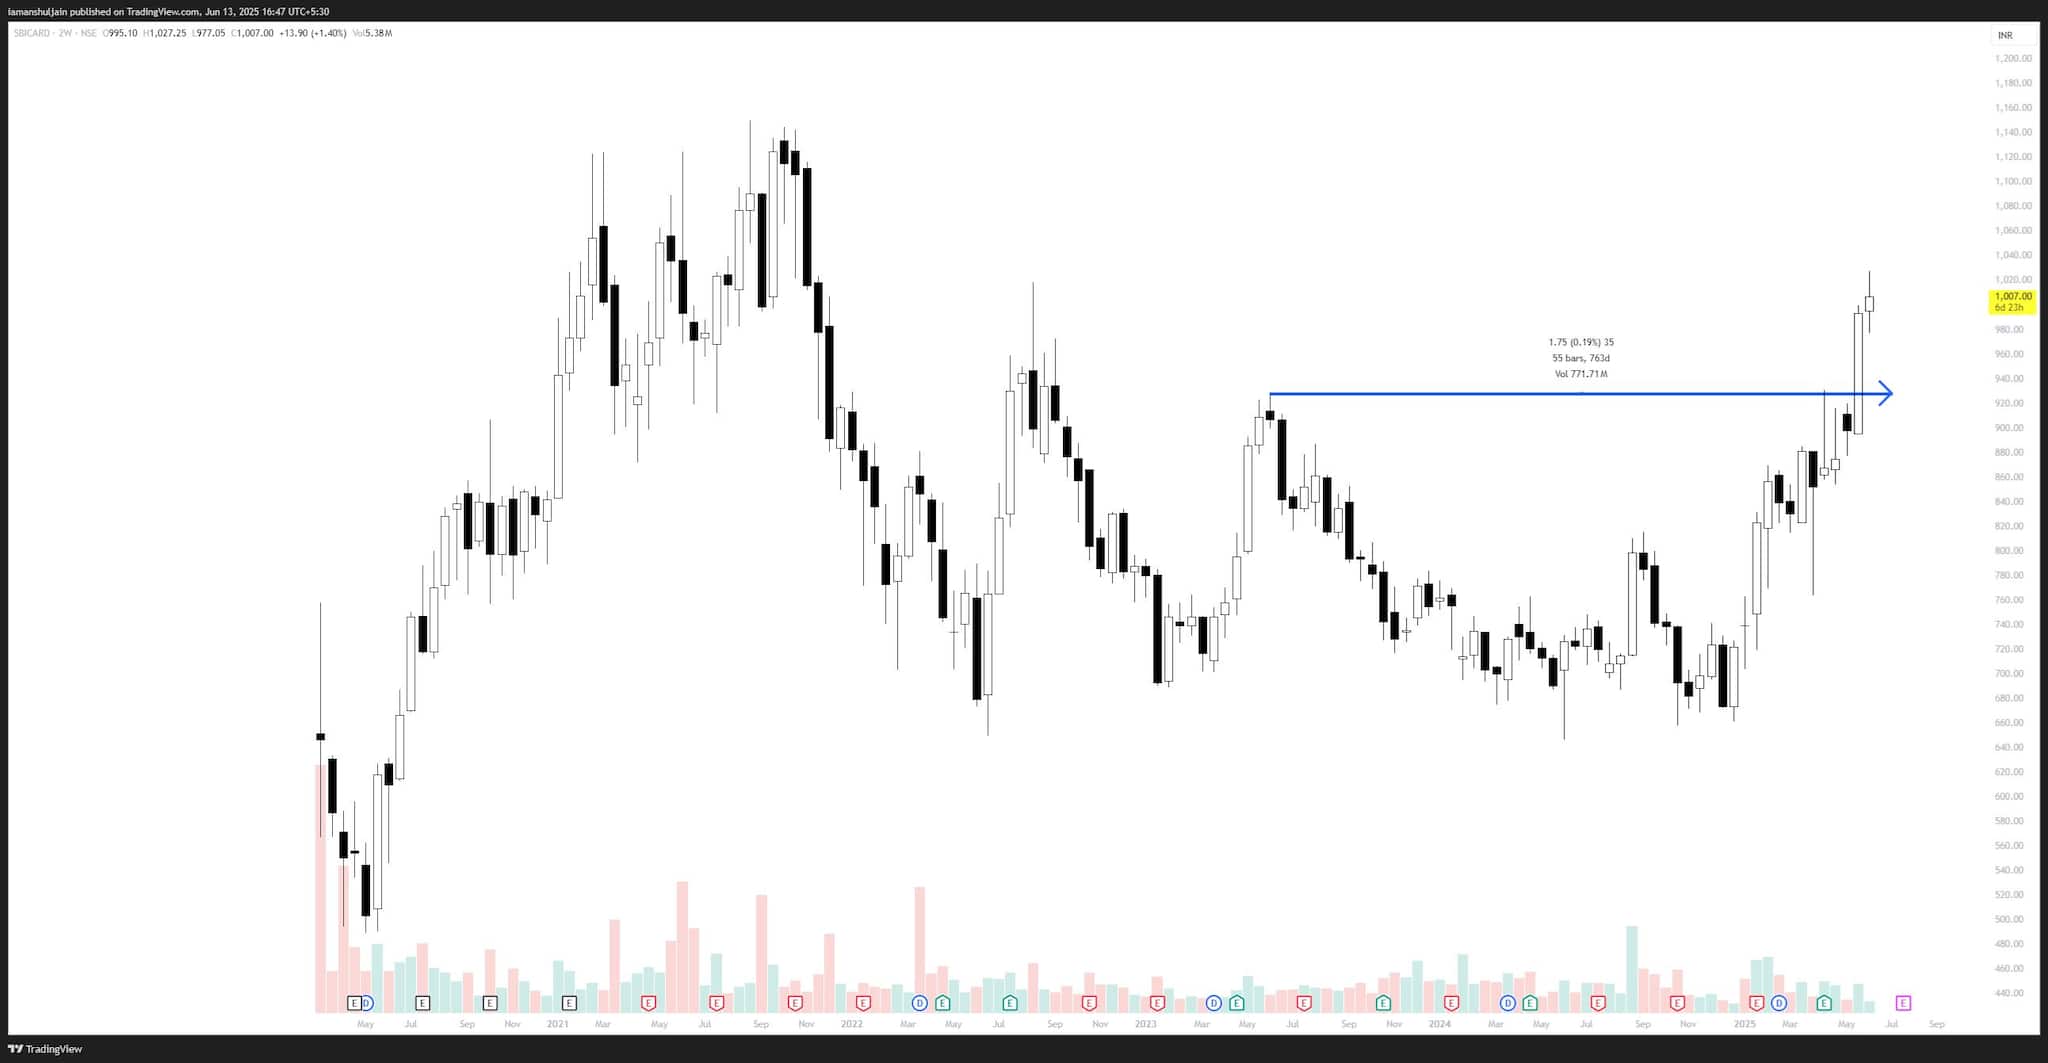
SBI Card has broken out of a 2-year-long rounding bottom pattern, though with relatively lower breakout volumes. However, the base structure shows strong accumulation, suggesting potential for volume expansion in follow-through sessions. With weekly moving averages stretched, a short consolidation phase is expected for realignment. Post-consolidation, the stock is likely to resume its uptrend toward its all-time high of Rs 1,149.9, making it a candidate for a buy-on-dips strategy.
Strategy: Buy
Target: Rs 1,150
Stop-Loss: Rs 980
Disclaimer: The views and investment tips expressed by investment experts on Moneycontrol.com are their own and not those of the website or its management. Moneycontrol.com advises users to check with certified experts before taking any investment decisions.
Discover the latest Business News, Sensex, and Nifty updates. Obtain Personal Finance insights, tax queries, and expert opinions on Moneycontrol or download the Moneycontrol App to stay updated!
Find the best of Al News in one place, specially curated for you every weekend.
Stay on top of the latest tech trends and biggest startup news.


