


Equity benchmark indices closed moderately lower amid a lacklustre session, while the broader markets were hit hard, with market breadth strongly dominated by bears. About 2,103 shares declined, compared to 505 advancing shares on the NSE. The market may consolidate further with a negative bias. Below are some short-term trading ideas to consider:
Om Mehra, Technical Analyst at Samco SecuritiesEicher Motors | CMP: Rs 5,493.5
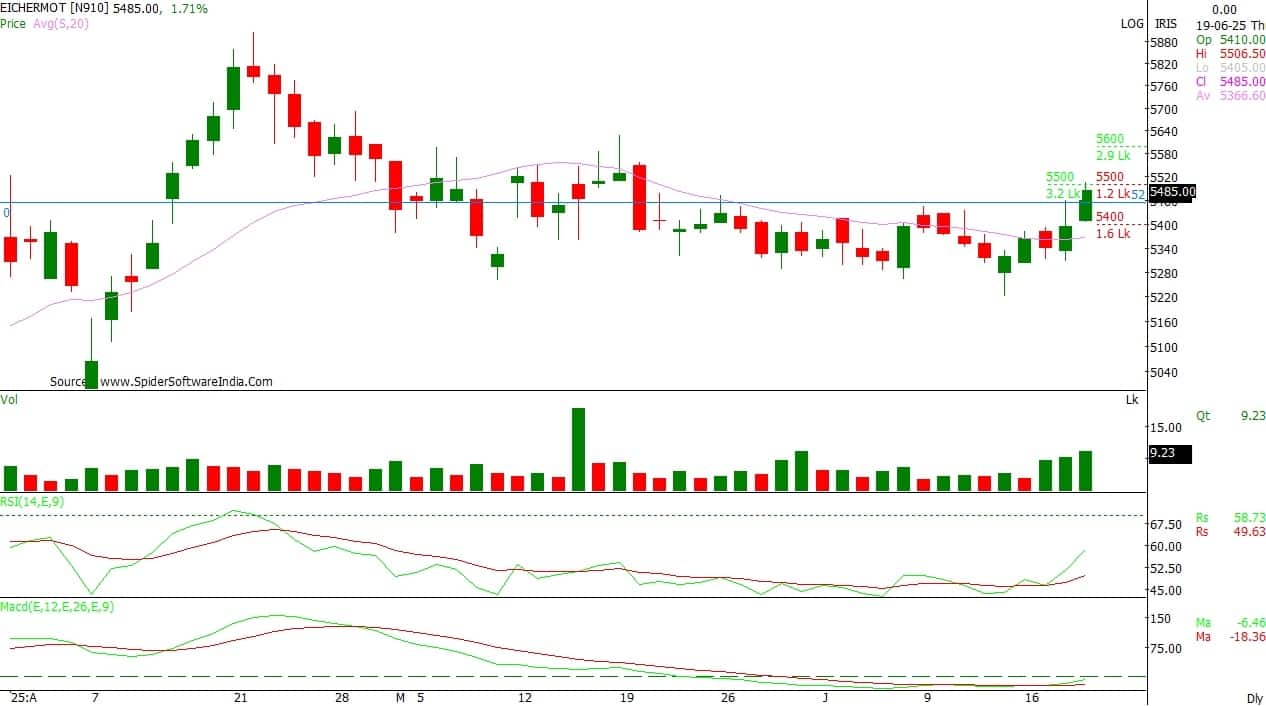
Eicher Motors has finally broken out of a horizontal channel that had been intact for several weeks. The stock decisively moved higher in Thursday’s session with the highest volume seen in over a month, signaling renewed buying interest.
This breakout comes after a prolonged consolidation phase, with the stock now trading above the 20-day and 50-day moving averages. The RSI has sharply risen to 59, turning upward from a flat range and indicating that momentum is picking up. Meanwhile, the MACD has just flipped into positive territory, with the fast and slow lines converging and the histogram moving back above the neutral line—a sign of early strength.
The previous resistance near Rs 5,400 has now turned into immediate support, while the broader base around Rs 5,280 remains a strong floor for the near term. Sustaining above Rs 5,520, a move toward higher levels looks probable. Hence, based on the technical structure, one can initiate a long position in Eicher Motors at the current market price (CMP).
Strategy: Buy
Target: Rs 5,850
Stop-Loss: Rs 5,340
Bharti Airtel | CMP: Rs 1,877

After weeks of rangebound movement, Bharti Airtel is showing strength as it inches closer to the upper end of its consolidation zone. The stock is now hovering just below the key Rs 1,890 resistance level that has capped recent attempts to move higher.
The stock remains above its 20-day and 50-day moving averages, with the price displaying a gradual upward bias. The RSI has improved to 57, reflecting growing momentum, while the MACD is on the verge of a bullish crossover. The volume has remained modest but steady, and the hourly chart reflects a positive outlook. A decisive close above Rs 1,890 could mark a short-term breakout and unlock further upside.
Hence, based on the technical structure, one can initiate a long position in Bharti Airtel at the CMP.
Strategy: Buy
Target: Rs 1,950
Stop-Loss: Rs 1,842
Mandar Bhojane, Equity Research Analyst at Choice BrokingTata Consumer Products | CMP: Rs 1,088.3
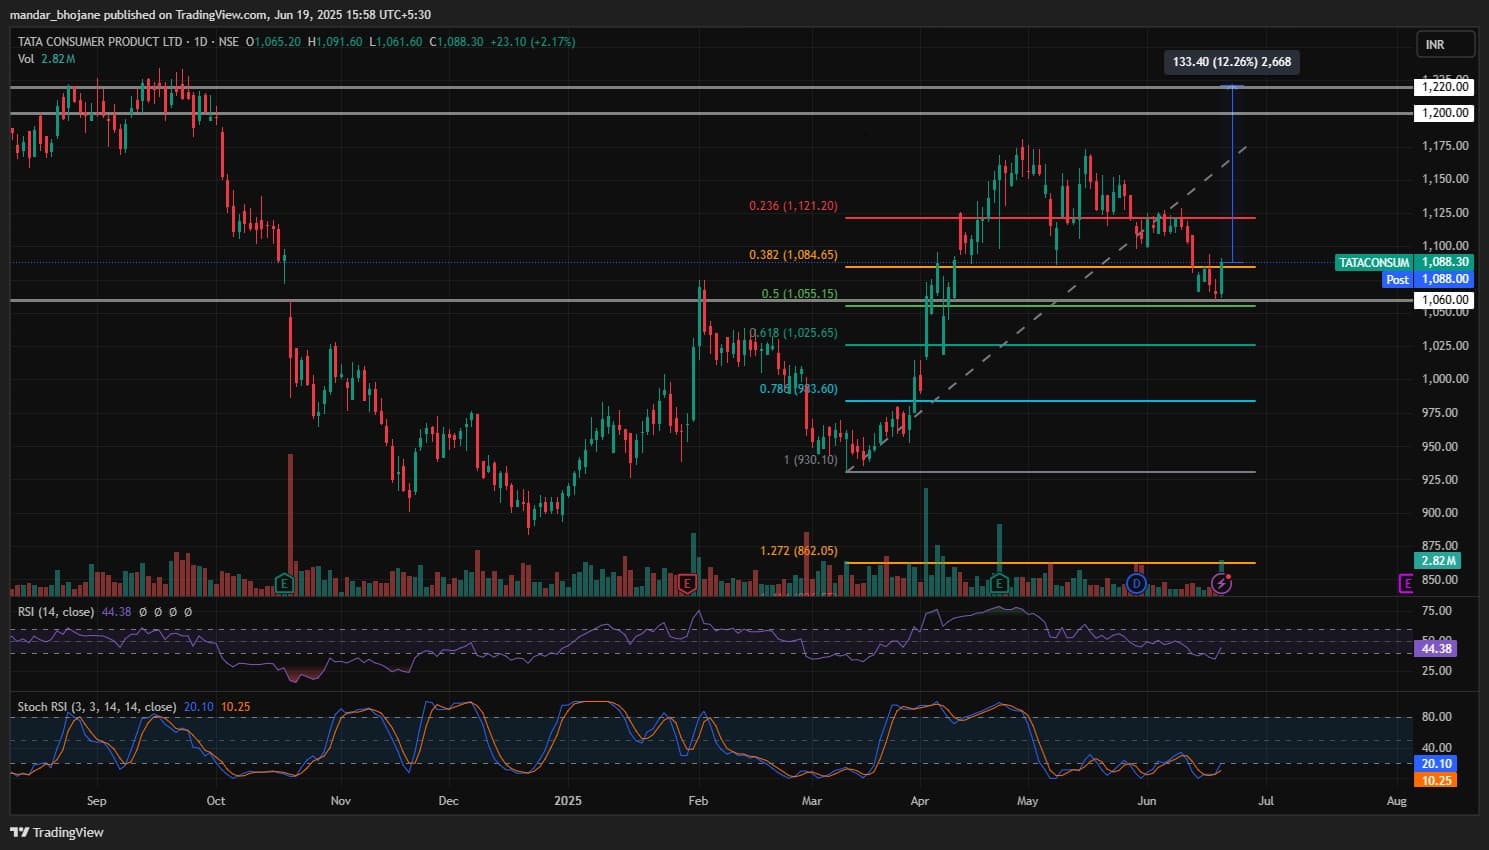
Tata Consumer Products is showing signs of a bullish reversal from a major support zone. The recent formation of a Morning Star pattern on the daily chart signals a potential trend reversal. This is further supported by rising trading volumes, indicating renewed buying interest and strengthening sentiment around the stock.
The stock has immediate support around the Rs 1,060 level, which can be considered a strong accumulation zone for investors looking to enter on dips. The RSI stands at 44.38 and is trending upwards, reflecting increasing bullish momentum. This shift suggests that the recent downside pressure may be easing, and buyers are gradually gaining control.
Strategy: Buy
Target: Rs 1,200, Rs 1,220
Stop-Loss: Rs 1,030
Mahindra and Mahindra | CMP: Rs 3,094.8
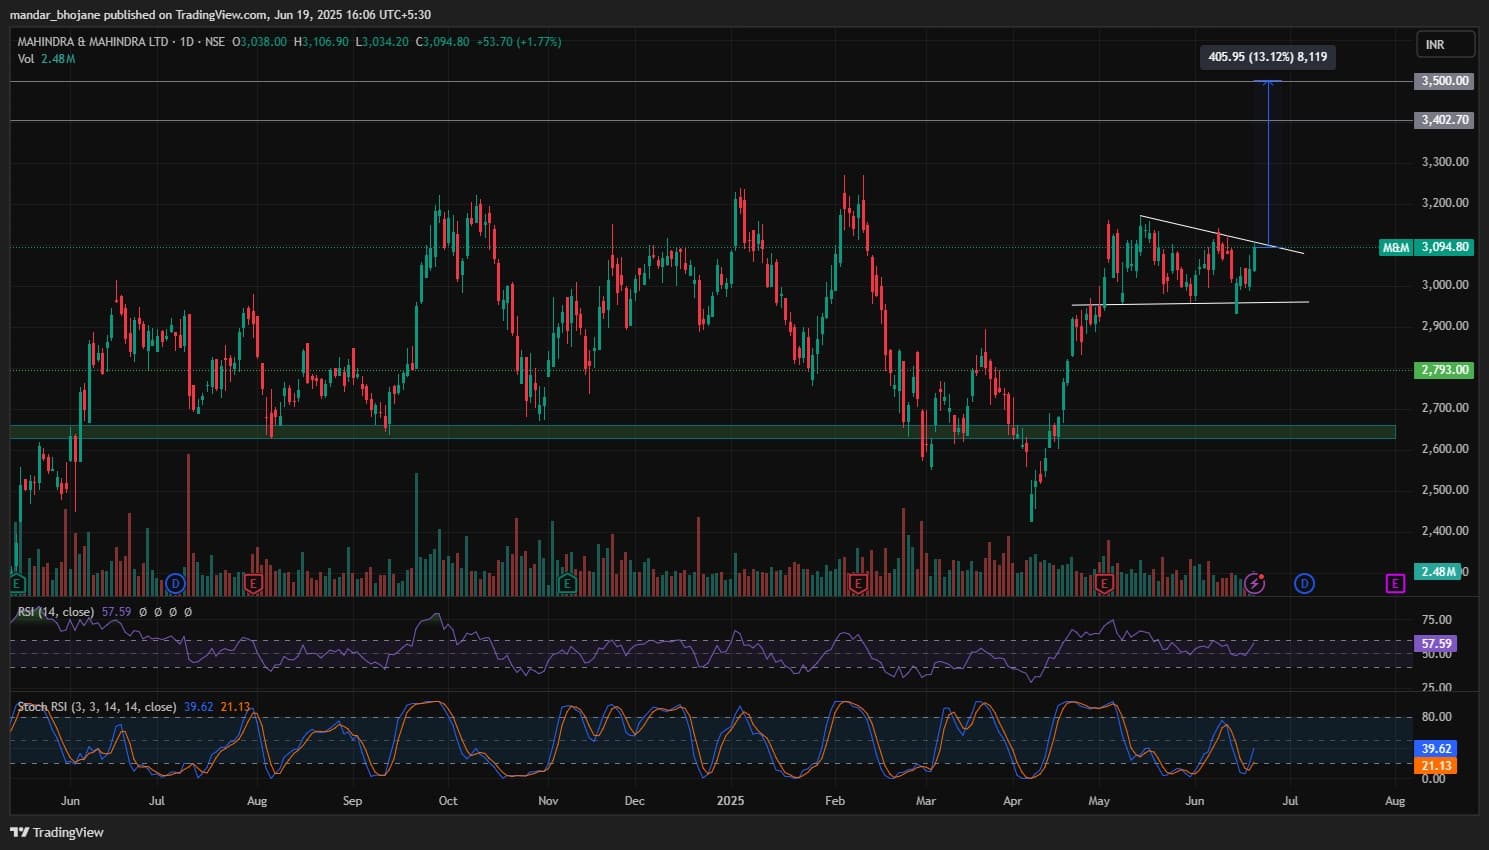
M&M has been consolidating in a narrow range and is now showing signs of strength as it approaches a breakout. The stock is forming a flag and pole pattern on the daily chart, which is typically a bullish continuation pattern. Rising trading volumes are indicating increasing investor interest and support the likelihood of a breakout in the short term.
A close above the key resistance level of Rs 3,100 would confirm the breakout and further strengthen the bullish momentum. The RSI is at 57.60, suggesting positive momentum while still offering room for further upside. On the downside, immediate support is placed at Rs 3,040, which could act as a good entry point for traders looking to buy on dips.
Strategy: Buy
Target: Rs 3,400, Rs 3,500
Stop-Loss: Rs 2,930
JSW Steel | CMP: Rs 996
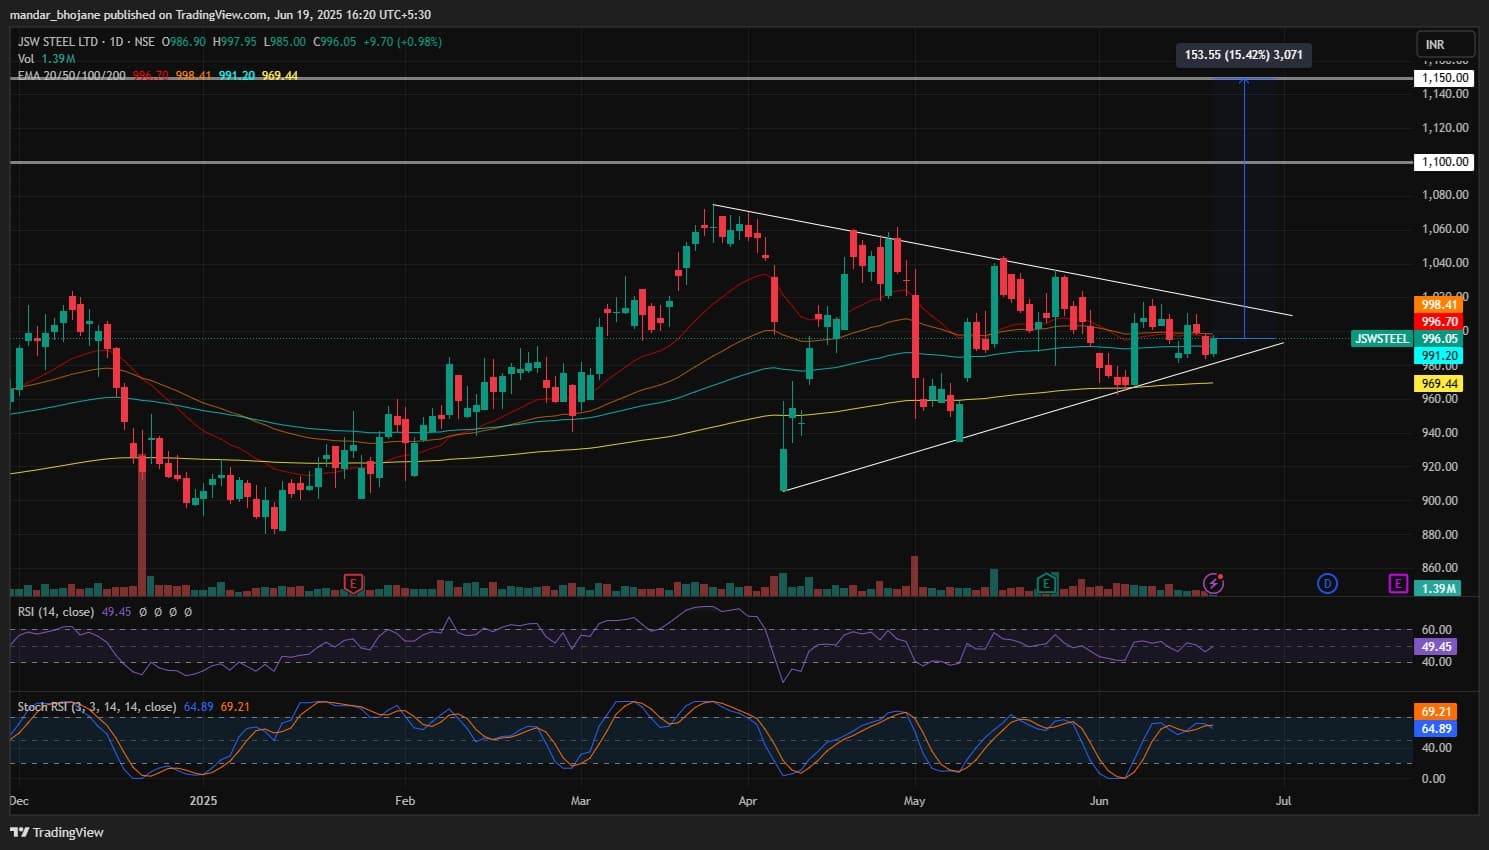
JSW Steel has recently formed a symmetrical triangle pattern on the daily chart, which typically indicates a consolidation phase before a significant move. The rising volume accompanying this pattern suggests growing interest and the potential for a trend reversal. The stock is now nearing a breakout point, signaling the emergence of strong bullish momentum in both the short and long term.
A decisive close above the Rs 1,005 level will act as confirmation of the breakout, likely reinforcing the uptrend and paving the way for further gains. The RSI is currently at 49.45, pointing to gradually building positive momentum while still leaving room for further upside. On the downside, immediate support lies at Rs 980, which can be seen as an attractive level for buying on dips.
Strategy: Buy
Target: Rs 1,100, Rs 1,150
Stop-Loss: Rs 950
Chandan Taparia, Head Derivatives & Technicals, Wealth Management at Motilal Oswal Financial ServicesWipro | CMP: Rs 265.6

Wipro has broken out of an ascending triangle pattern on the daily chart, a formation that typically signals bullish continuation. The breakout is supported by the stock moving above its 100-day exponential moving average, suggesting strengthening momentum. Moreover, the MACD indicator is on a rising trajectory, adding further confirmation to the positive price action.
Strategy: Buy
Target: Rs 282
Stop-Loss: Rs 258
Oil and Natural Gas Corporation | CMP: Rs 251.55

ONGC is currently retesting its breakout from a symmetrical triangle formation on the daily chart. The price action has shown resilience, with the formation of a bullish Hammer candlestick, which suggests renewed buying interest at lower levels. Additionally, the MACD remains positively aligned, supporting the case for further upside.
Strategy: Buy
Target: Rs 260
Stop-Loss: Rs 245
Disclaimer: The views and investment tips expressed by investment experts on Moneycontrol.com are their own and not those of the website or its management. Moneycontrol.com advises users to check with certified experts before taking any investment decisions.Discover the latest Business News, Sensex, and Nifty updates. Obtain Personal Finance insights, tax queries, and expert opinions on Moneycontrol or download the Moneycontrol App to stay updated!
Find the best of Al News in one place, specially curated for you every weekend.
Stay on top of the latest tech trends and biggest startup news.


