


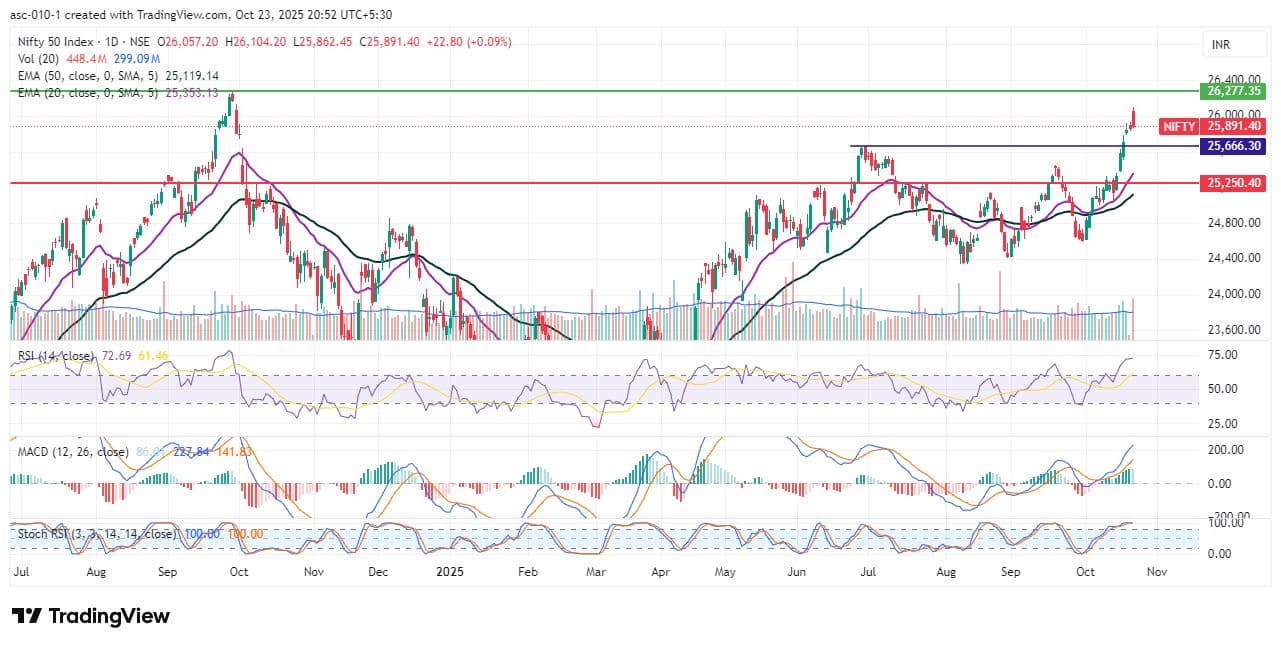
The Nifty 50 surpassed the psychological 26,000 mark intraday for the first time since September 30 but could not sustain that level at the close due to profit booking on October 23. The index wiped out an over 200-point rally before ending with moderate gains, thereby sustaining its northward journey for the sixth consecutive session. The uptrend remains intact despite the formation of a bearish candlestick pattern. Experts note that as long as the index defends the 25,700 zone support, the upmove toward the 26,000–26,100 hurdle cannot be ruled out, followed by the record high of 26,277 — the crucial resistance level beyond which the index would enter uncharted territory.
Here are 15 data points we have collated to help you spot profitable trades:
1) Key Levels For The Nifty 50 (25,891)
Resistance based on pivot points: 26,045, 26,102, and 26,194
Support based on pivot points: 25,860, 25,803, and 25,711
Special Formation: The Nifty 50 formed a bearish candlestick pattern with a minor upper shadow on the daily timeframe, indicating profit-booking-led pressure at higher levels. However, the higher high–higher low formation remains intact. The index continues to trade well above its crucial moving averages, while the RSI stays in the bullish territory, suggesting underlying strength in momentum despite the day’s corrective move. All these factors indicate continued positivity and resilience in the broader trend.
2) Key Levels For The Bank Nifty (58,078)
Resistance based on pivot points: 58,441, 58,589, and 58,828
Support based on pivot points: 57,963, 57,815, and 57,576
Resistance based on Fibonacci retracement: 58,735, 60,142
Support based on Fibonacci retracement: 57,394, 56,661
Special Formation: The Bank Nifty also witnessed profit booking after surpassing 58,500 intraday, closing with 71 points of gains and hitting a fresh record high of 58,577 during the session. The index formed a bearish candle with a long upper shadow and a minor lower shadow on the daily charts, signalling selling pressure and intraday volatility. Despite this, the index maintained its higher top–higher bottom formation, with all crucial moving averages trending upward. The RSI surged to 76.64, while the MACD sustained a positive crossover, reflecting continued bullish momentum. All these indicators point toward ongoing strength in the banking space despite near-term volatility.

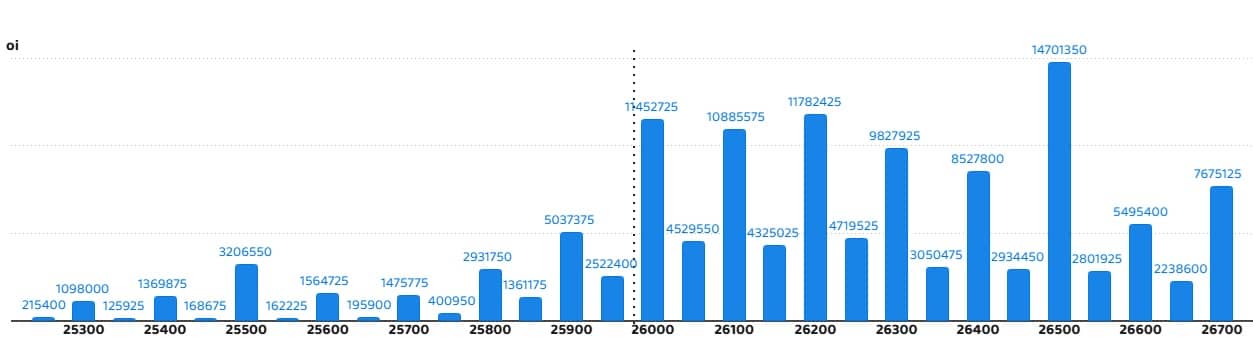
According to the monthly options data, the 26,500 strike holds the maximum Call open interest (with 1.47 crore contracts). This level can act as a key resistance for the Nifty in the short term. It was followed by the 26,200 strike (1.17 crore contracts), and the 26,000 strike (1.14 crore contracts).
Maximum Call writing was observed at the 26,500 strike, which saw an addition of 53.82 lakh contracts, followed by the 26,200 and 26,100 strikes, which added 50.28 lakh and 49.19 lakh contracts, respectively. The maximum Call unwinding was seen at the 25,900 strike, which shed 22.25 lakh contracts, followed by the 25,800 and 25,850 strikes, which shed 19.15 lakh and 10.71 lakh contracts, respectively.
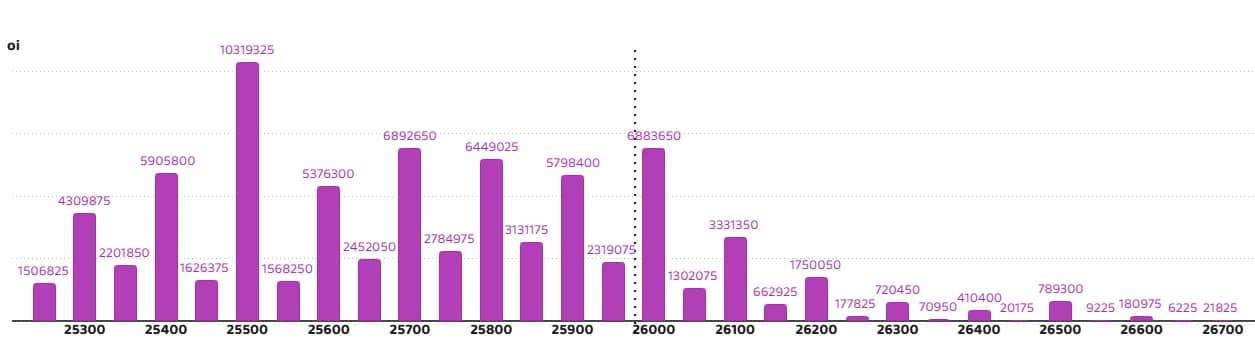
On the Put side, the maximum Put open interest was seen at the 25,500 strike (with 1.03 crore contracts), which can act as a key support level for the Nifty. It was followed by the 25,700 strike (68.92 lakh contracts) and the 26,000 strike (68.83 lakh contracts).
The maximum Put writing was placed at the 26,000 strike, which saw an addition of 33.08 lakh contracts, followed by the 26,100 and 25,750 strikes, which added 29.31 lakh and 16.12 lakh contracts, respectively. The maximum Put unwinding was seen at the 25,450 strike, which shed 8.4 lakh contracts, followed by the 25,600 and 25,250 strikes, which shed 3.93 lakh and 22,650 contracts, respectively.
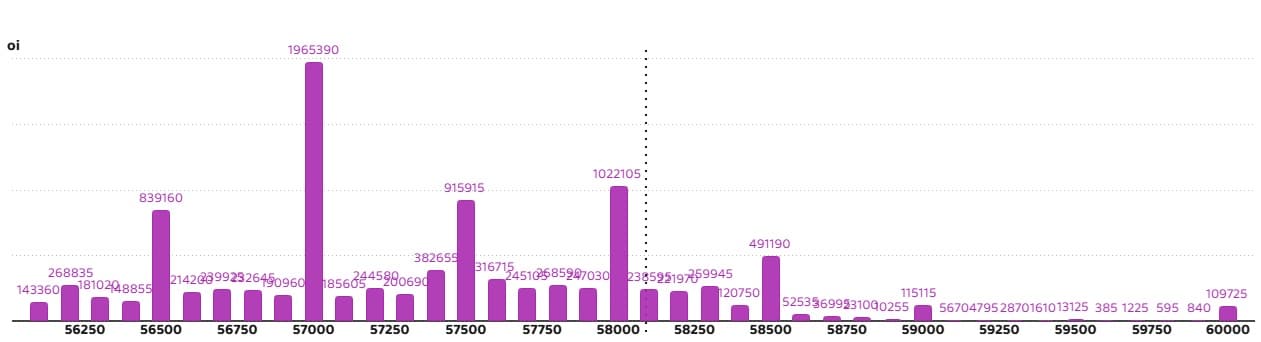
5) Bank Nifty Call Options Data
According to the monthly options data, the maximum Call open interest was placed at the 60,000 strike, with 13.79 lakh contracts. This can act as a key resistance level for the index in the short term. It was followed by the 58,500 strike (12.91 lakh contracts) and the 58,000 strike (12.81 lakh contracts).
Maximum Call writing was observed at the 58,500 strike (with the addition of 4.04 lakh contracts), followed by the 58,800 (3.19 lakh contracts) and 58,300 strike (2.92 lakh contracts). The maximum Call unwinding was seen at the 57,000 strike, which shed 4.85 lakh contracts, followed by the 58,000 and 57,500 strikes, which shed 3.99 lakh and 2.43 lakh contracts, respectively.
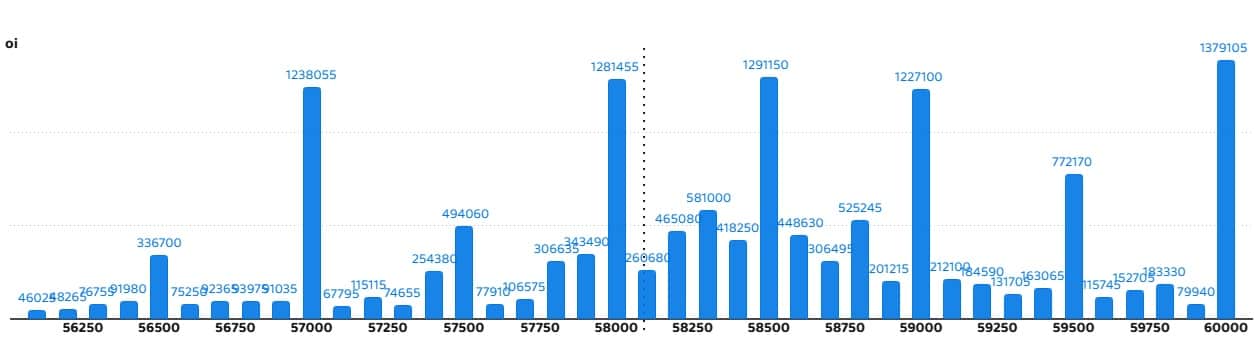
6) Bank Nifty Put Options Data
On the Put side, the 57,000 strike holds the maximum Put open interest (with 19.65 lakh contracts), which can act as a key support level for the index. This was followed by the 58,000 strike (10.22 lakh contracts) and the 57,500 strike (9.15 lakh contracts).
The maximum Put writing was placed at the 58,500 strike (which added 3.78 lakh contracts), followed by the 58,300 strike (1.85 lakh contracts) and the 57,600 strike (1.42 lakh contracts). The maximum Put unwinding was seen at the 57,200 strike which shed 77,560 contracts, followed by the 57,400 and 56,600 strikes, which shed 56,665 and 50,470 contracts, respectively.
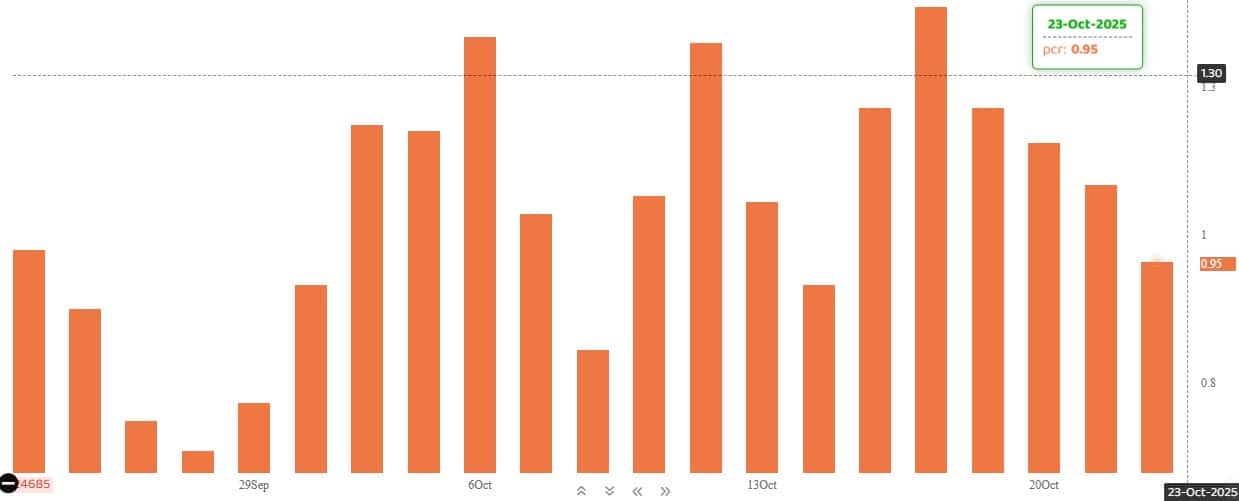
The Nifty Put-Call ratio (PCR), which indicates the mood of the market, fell to 0.95 on October 23, compared to 1.08 in the previous session.
The increasing PCR, or being higher than 0.7 or surpassing 1, means traders are selling more Put options than Call options, which generally indicates the firming up of a bullish sentiment in the market. If the ratio falls below 0.7 or moves towards 0.5, then it indicates selling in Calls is higher than selling in Puts, reflecting a bearish mood in the market.
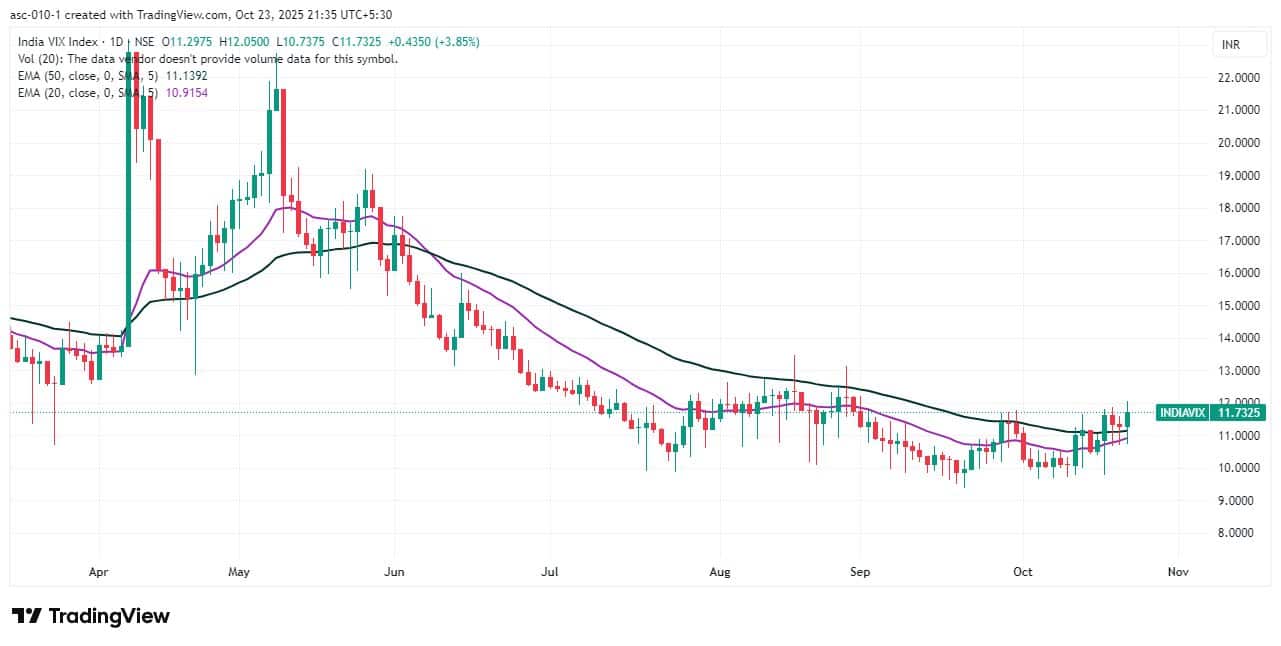
9) India VIX
The India VIX, which measures expected market volatility, climbed 3.85 percent to 11.73 after a couple of days of decline. It also sustained above short- and medium-term moving averages, signaling some caution for bulls. However, experts note that volatility does not pose a major risk unless the VIX sustains above the 13–14 zone.
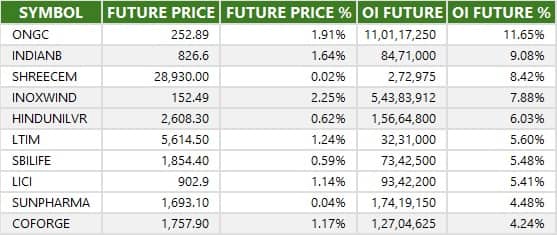
A long build-up was seen in 50 stocks. An increase in open interest (OI) and price indicates a build-up of long positions.
11) Long Unwinding (37 Stocks)
37 stocks saw a decline in open interest (OI) along with a fall in price, indicating long unwinding.
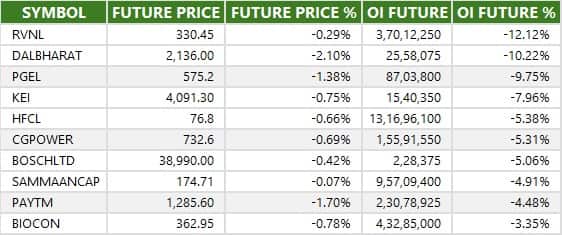
12) Short Build-up (47 Stocks)
47 stocks saw an increase in OI along with a fall in price, indicating a build-up of short positions.

13) Short-Covering (79 Stocks)
79 stocks saw short-covering, meaning a decrease in OI, along with a price increase.

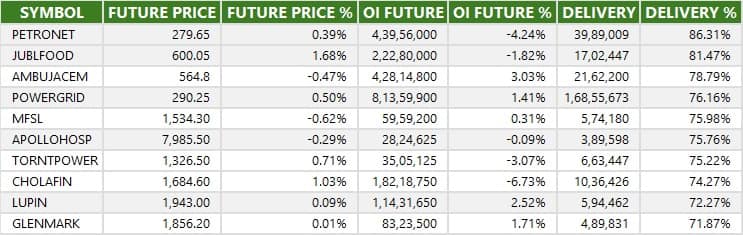
Here are the stocks that saw a high share of delivery trades. A high share of delivery reflects investing (as opposed to trading) interest in a stock.
Securities banned under the F&O segment include companies where derivative contracts cross 95 percent of the market-wide position limit.
Stocks added to F&O ban: Nil
Stocks retained in F&O ban: Nil
Stocks removed from F&O ban: Sammaan Capital
Disclaimer: The views and investment tips expressed by experts on Moneycontrol are their own and not those of the website or its management. Moneycontrol advises users to check with certified experts before taking any investment decisions.Disclaimer: Moneycontrol is a part of the Network18 group. Network18 is controlled by Independent Media Trust, of which Reliance Industries is the sole beneficiary.Discover the latest Business News, Sensex, and Nifty updates. Obtain Personal Finance insights, tax queries, and expert opinions on Moneycontrol or download the Moneycontrol App to stay updated!
Find the best of Al News in one place, specially curated for you every weekend.
Stay on top of the latest tech trends and biggest startup news.


