


By Jigar S Patel, Senior Manager - Equity Research at Anand Rathi
The domestic markets experienced a turbulent start to the week, primarily influenced by disappointing economic data from the US and an unexpected rate hike in Japan. These factors triggered a significant selloff, causing the Nifty 50 index to plummet by over 700 points in a single trading session. The index briefly dipped below the 24,000 mark, but it managed to recover and consolidate in the following sessions. However, despite the recovery, Nifty struggled to breach the 24,400 level and ultimately ended the week with a decline of approximately 1.5 percent.
The sharp decline was somewhat expected, as a negative divergence in the daily Relative Strength Index (RSI) had appeared when Nifty reached a new high around the 25,100 mark. As the index neared the 24,000 level, it encountered a trendline breakout on the daily chart but found support near the 24,000 – 23,900 zone, which coincided with other trendlines. Moving forward, the 24,500 – 23,900 range will be critical in determining the market’s direction. A close above 24,500 could signal a bullish reversal, potentially leading to new highs, while a breach of the 23,900 level may heighten market anxiety and push the index toward the 23,500 – 23,200 zone.
Given the current price action, an upside breakout seems more likely, suggesting that a move above 24,500 could pave the way for further gains. Traders are advised to avoid aggressive positions and to maintain strict stop-loss levels.
As for the Nifty Bank index, it briefly fell below the 50,000 mark but managed to close the week near 50,500. Technically, the index found support at a falling trendline and the 100-day Exponential Moving Average (DEMA). The 49,650 level will be crucial support in the coming week. If this level holds, the index could retest the 52,000 mark. However, if the index drops below 49,650, caution is advised when taking long positions in banking stocks.
Here are three buy calls for short term:
Schaeffler India | CMP: Rs 3,960.7
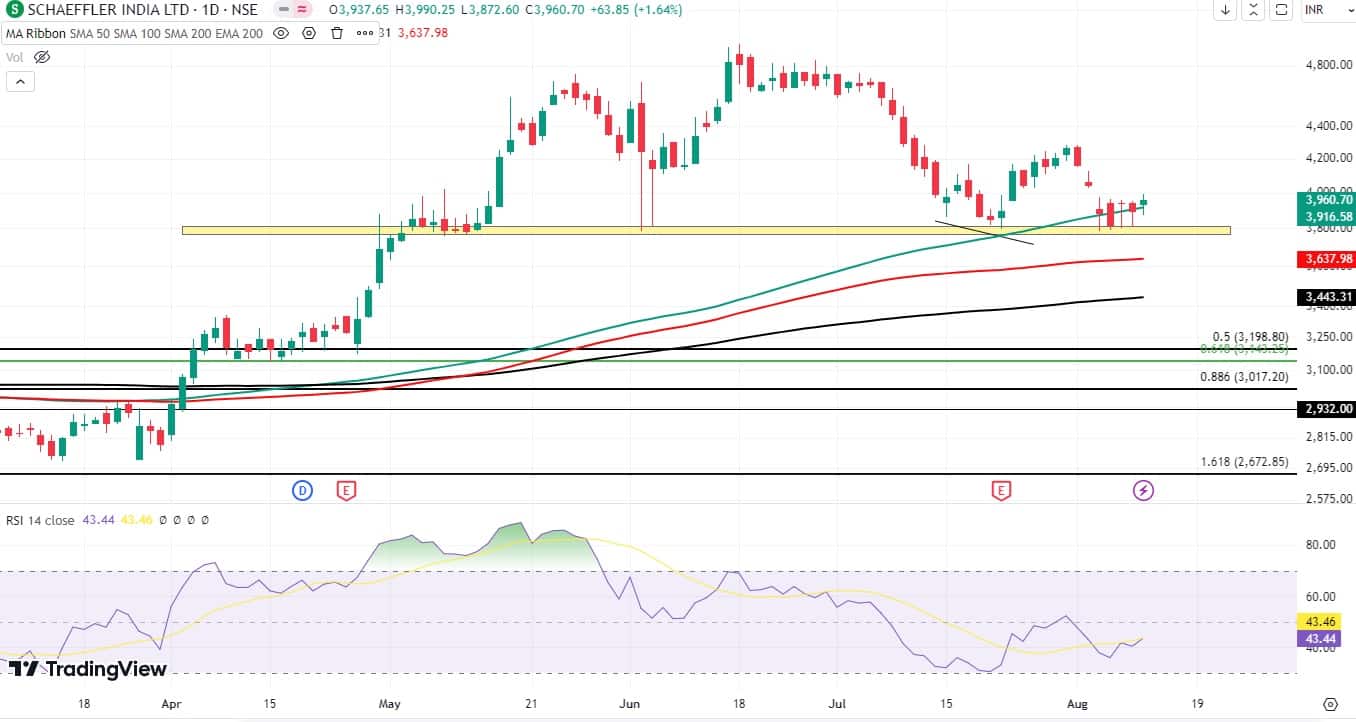
Schaeffler experienced a significant decline after reaching its peak near Rs 4,950, dropping approximately 1,155 rupees, which translates to a substantial 23 percent decrease in price. Currently, the stock appears to have found support around its 100-day Exponential Moving Average (DEMA), forming a double bottom pattern. Additionally, the Relative Strength Index (RSI) on the hourly chart is showing bullish divergence, suggesting a potential reversal in the stock's momentum. Investors might consider buying the stock in the price range of Rs 3,950 to Rs 3,975. The suggested upside target is Rs 4,350, with a stop-loss set at Rs 3,770 based on a daily closing price to manage risk.
Strategy: Buy
Target: Rs 4,350
Stop-Loss: Rs 3,770
FSN E-Commerce Ventures | CMP: Rs 192

After a brief period of consolidation around its 21- and 50-day Exponential Moving Averages (DEMA), Nykaa has successfully surpassed its previous high of approximately Rs 184. This consolidation phase indicates the formation of a robust base, setting the stage for further upward movement. From a technical analysis perspective, the daily Relative Strength Index (RSI) has rebounded from the 50 level, signaling a potential increase in bullish momentum over the coming sessions. Based on these observations, it is recommended to buy Nykaa within the price range of Rs 190-195. The anticipated upside target is Rs 220, with a stop-loss set at Rs 178 based on a daily closing price to safeguard against potential downside risks.
Strategy: Buy
Target: Rs 220
Stop-Loss: Rs 178
SBI Cards and Payment Services | CMP: Rs 710
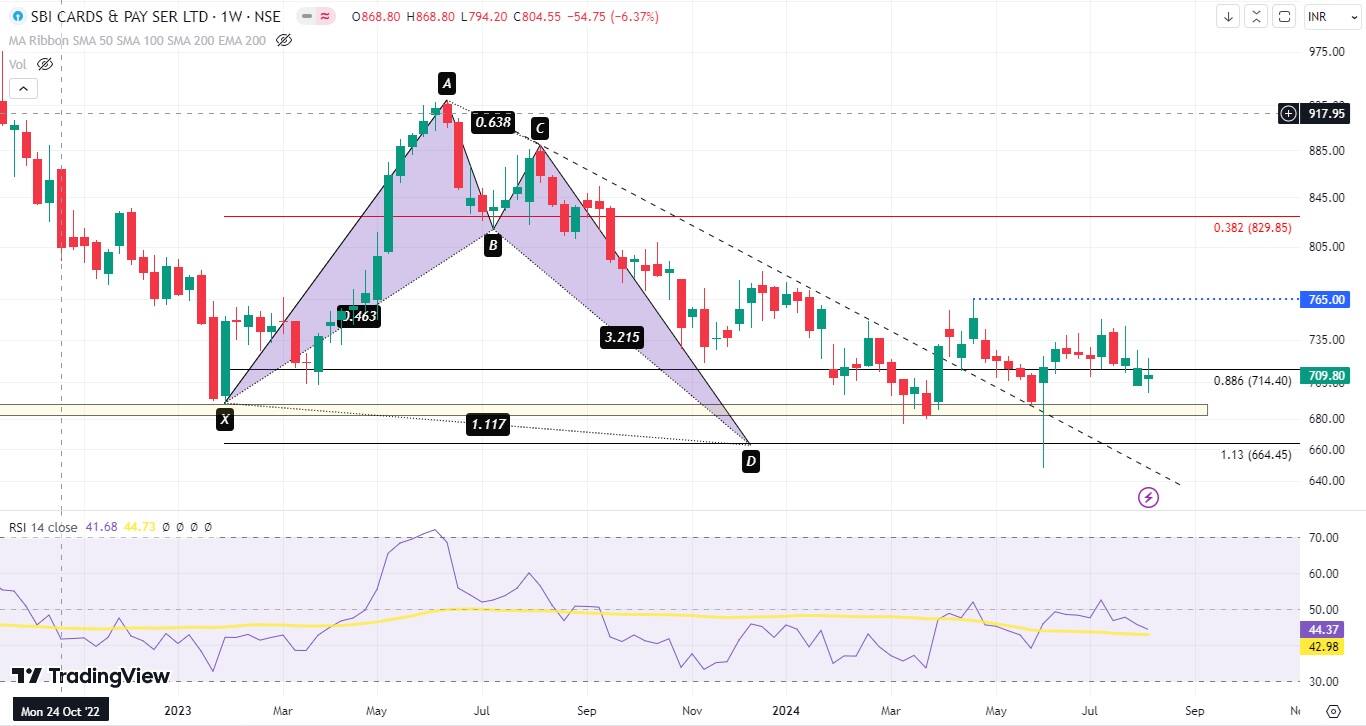
Following a peak near Rs 933, SBI Card and Payment Services experienced a significant downturn, with a sharp decline of nearly Rs 280, representing a substantial decrease of approximately 30% in its overall value. Despite this steep drop, SBI Card has managed to stabilize around the Rs 675 level over the past week, forming a sustained support base. This stabilization is a critical sign of potential recovery. Notably, during this period, a bullish alternate pattern has emerged near the Rs 680-710 level, further confirming positive market sentiment. This pattern indicates that the market may be shifting from a bearish to a bullish phase, suggesting a potential rebound.
Moreover, the analysis of the daily RSI reveals a bullish divergence, a strong technical indicator signaling a favourable outlook for the stock. A bullish divergence occurs when the stock price hits a new low while the RSI hits a higher low, indicating that the selling momentum is weakening. Considering these positive technical indicators and chart patterns, investors might find it prudent to initiate buy positions within the range of Rs 705 to Rs 715. The upside objective for this strategy is targeted at Rs 800, suggesting potential gains as the stock price recovers. To manage risk effectively, a stop-loss order should be set at Rs 665 on a daily closing basis.
Strategy: Buy
Target: Rs 800
Stop-Loss: Rs 665
Disclaimer: The views and investment tips expressed by investment experts on Moneycontrol.com are their own and not those of the website or its management. Moneycontrol.com advises users to check with certified experts before taking any investment decisions.

Discover the latest Business News, Sensex, and Nifty updates. Obtain Personal Finance insights, tax queries, and expert opinions on Moneycontrol or download the Moneycontrol App to stay updated!
Find the best of Al News in one place, specially curated for you every weekend.
Stay on top of the latest tech trends and biggest startup news.


