


On the weekly charts, the Nifty is sustaining above the three-week high, which indicates positivity of the prices. On the daily chart, we see prices forming higher tops, higher bottoms, while prices have stayed above the 20-day moving average for the last four days.
On the indicator front, the relative strength index (RSI) plotted on the daily time frame is forming higher tops and higher bottoms. RSI has sustained above 50, confirming the positive momentum.
The level of 16,172, gap resistance, formed on June 13, will act as the immediate resistance. If the index sustains above this level, we may see prices moving higher to 16,580.
On the downside 15,724, which is the 20-DMA, will act as the immediate support followed by 15,511, which is the swing low.
The bullish view will be negated if the Nifty slips below 15,724 on a closing basis.
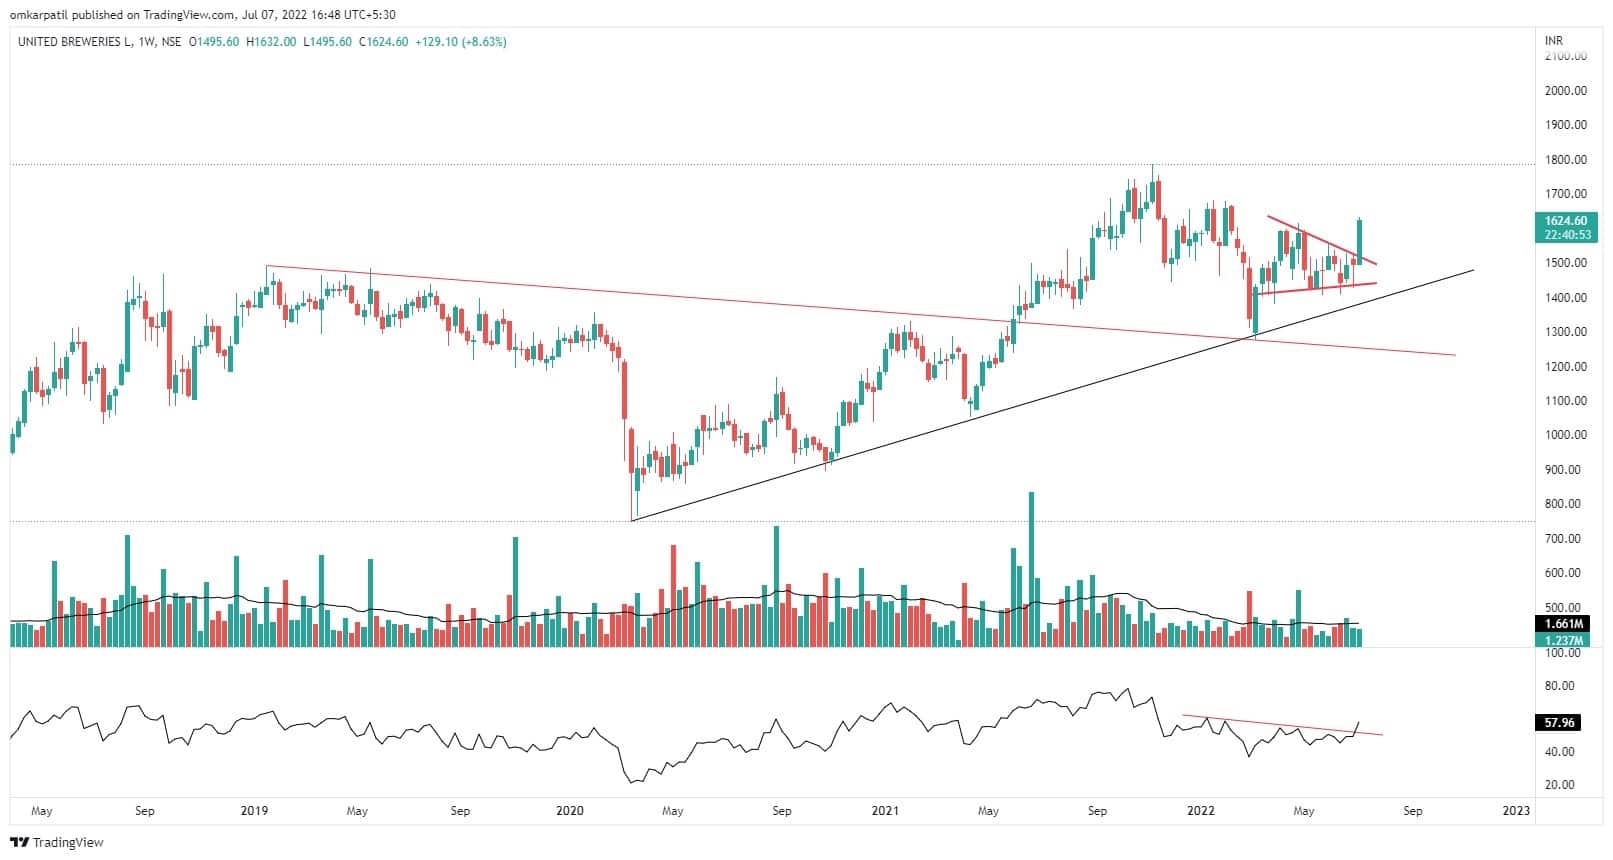
Here are three buy calls for next 2-3 weeks:United Breweries: Buy | LTP: Rs 1,624.60 | Stop-Loss: Rs 1,480 | Target: Rs 1,900 | Return: 17 percentOn the weekly chart, United Breweries is in a clear uptrend, forming high peaks, higher bottoms. In March 2022, prices showed a bounce on the upside from the trend line which is being respecting since the March 2020 low. At the same trend line, we witnessed a change in the polarity by prices around the level of Rs 1,290.
In the current week, we observed a positive breakout from descending triangle pattern, where prices again took support from the upward slopping trend line.
On the indicator front, RSI plotted on the weekly timeframe has given a breakout and is forming higher tops, higher bottoms, confirming the positive momentum.
We expect the stock to move higher to Rs 1,785. If it stays above this level, we may see prices move towards Rs 1,900.
We recommend a stop-loss at Rs 1,480 on the closing basis.
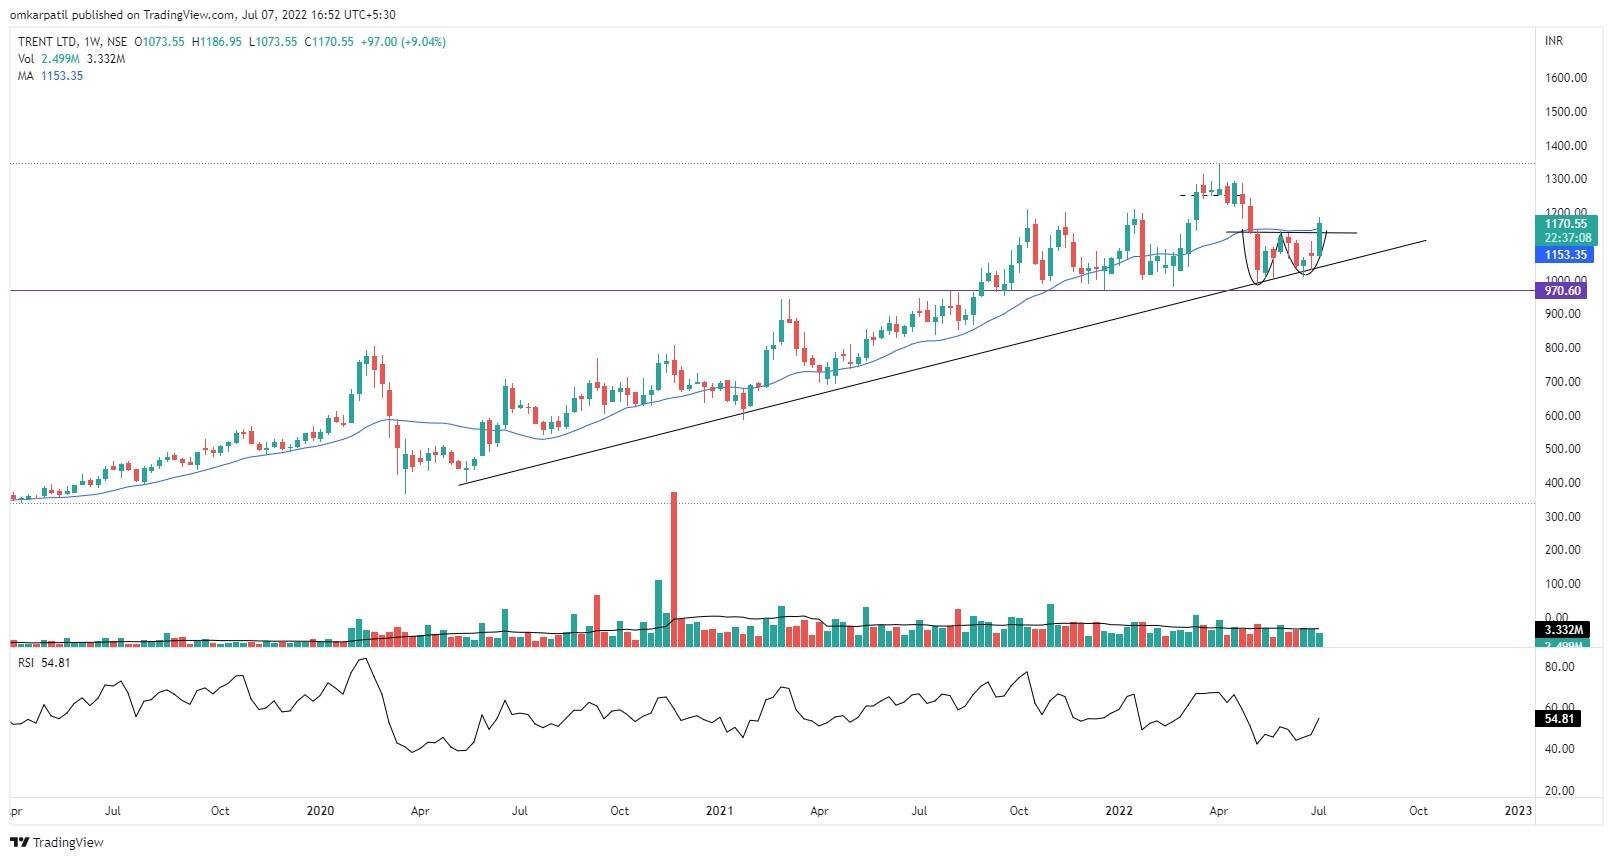
On the weekly chart, we witnessed a bounce back in the prices from the trend line, which is being respected since March 2022. Prices have closed above the 20-week exponential moving average (EMA), which acted as variable support to the prices.
This week, we have seen saw prices give a positive confirmation by closing above their previous week's high which was a Doji candle, formed taking the support from the trend line.
In the current week, we can spot a breakout from the double bottom pattern, which was formed at the crucial support around the level of Rs 970.
On the indicator front, the RSI has started to form higher high, higher low pattern and it is sustaining above the 50 mark.
We expect the price to move towards the previous swing high of Rs 1,346. We would recommend following a strict stop-loss of Rs 1,025 for this trade.
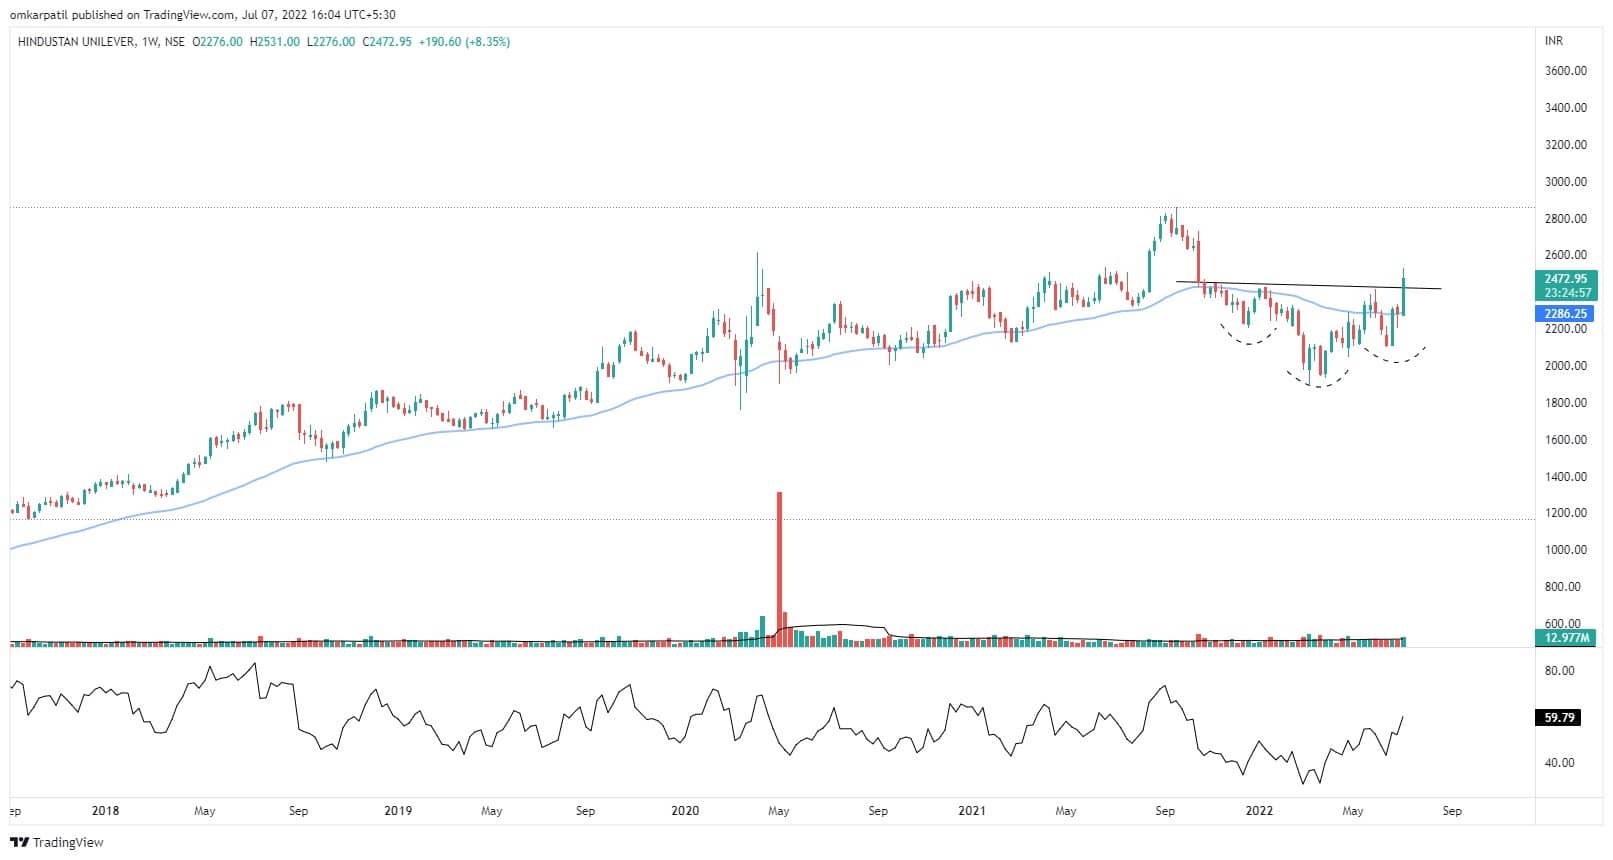
On the weekly timeframe of Hindustan Unilever, prices have given a breakout from Inverse Head and Shoulder pattern, which is a bullish reversal pattern, this week.
Prices have closed above 50-week EMA, which acted as a support to the prices.
RSI on the weekly chart is rising and is above 50, confirming the bullish momentum. Looking at the price action and technical parameters, we expect prices to move higher towards Rs 2,860.
We recommend following a stop-loss at Rs 2,275 on a closing basis.

Discover the latest Business News, Sensex, and Nifty updates. Obtain Personal Finance insights, tax queries, and expert opinions on Moneycontrol or download the Moneycontrol App to stay updated!
Find the best of Al News in one place, specially curated for you every weekend.
Stay on top of the latest tech trends and biggest startup news.


