

The Nifty ended lower for the fourth straight session on October 23, down 1.34 percent or 261 points, at 19,282. Global equities fell as the 10-year yield on the US Treasuries hit 5 percent for the first time since 2007 and as investors worried that the war between Israel and the Hamas could turn into a bigger Middle Eastern conflict. Broader market indices fell more than the Nifty even as the advance decline ratio went down sharply to 0.20:1 on the BSE, the lowest in 10 months.
The Nifty has broken down on the daily chart from the downward sloping trendline, adjoining the lows of August 30 and October 4. Indicators and oscillators like RSI (relative strength index), MACD (moving average convergence divergence) and DMI (directional movement index) have turned bearish for Nifty on daily and weekly charts.
The benchmark index formed a bearish double-top pattern at 19,850 on the daily chart and closed below the previous swing low of 19,635 which will interchange its role as resistance going forward. This level coincides with the 20-day EMA (exponential moving average) which is placed at the 19,640 levels. On the derivatives side, we have seen aggressive Call writing at the 19,500-19,700 levels.
Therefore, on the higher side, 19,600-19,700 can be considered as an immediate resistance for the Nifty and one should remain cautious till it closes above the 19,700 levels.
Immediate support for the index is expected at 19,100, which happens to be the level derived from the upward sloping trendline, adjoining major swing tops of October 2021 (18,604) and December 2022 (18,887).
We expect the market to remain bearish for the short term. Traders are advised to remain cautious till Nifty closes above 19,700 levels.
After massive outperformance during the CY22 till now, the short-term trend of the Midcap and Smallcap indices turned weak as they have closed below their short-term important moving averages. Therefore, our advice is to remain bearish on the midcap/smallcap space for now.
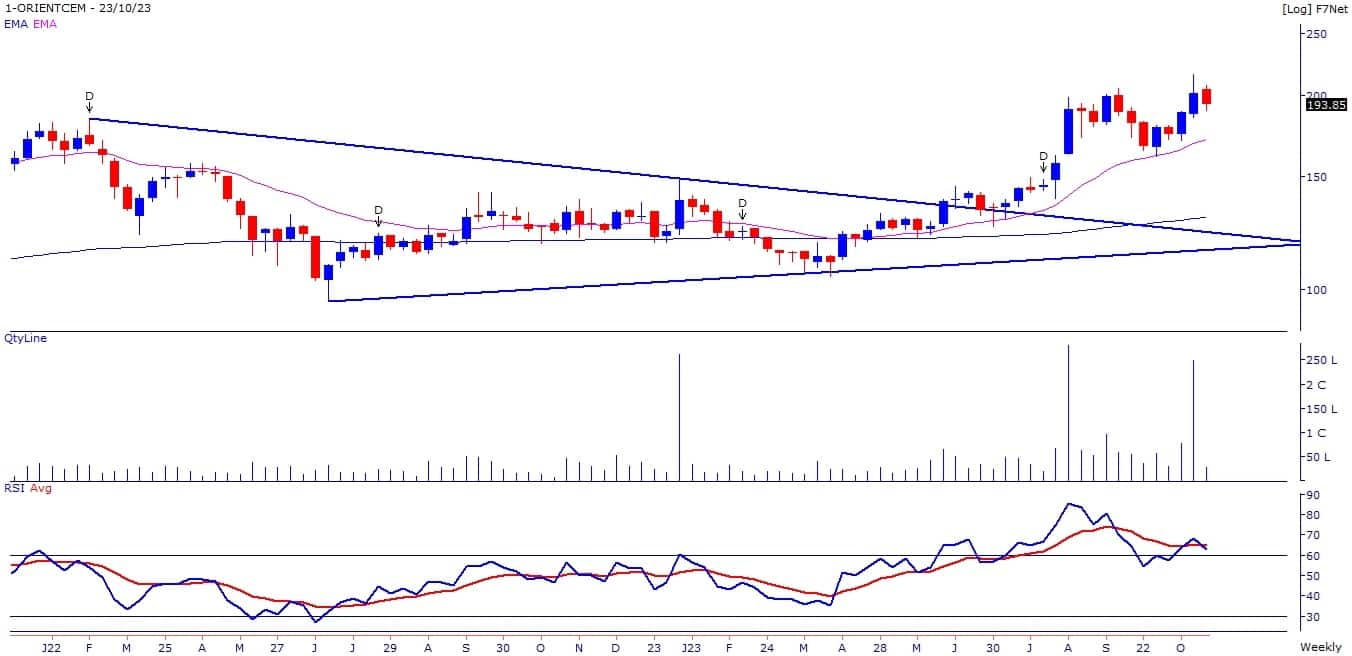
Here are two sell calls and one buy call for the next 3-4 weeks:Orient Cement: Buy | LTP: Rs 194 | Stop-Loss: Rs 178 | Target: Rs 205-215 | Return: 11 percentOn the month ended August 2023, the stock price broke out by surpassing the multiple top resistance of Rs 183 odd levels. The stock price has been forming bullish higher top, higher bottom formation on the weekly chart.
The stock price has corrected from the recent high which we believe is a buying opportunity for the short to medium term.
 Bank of Baroda November Future: Sell | LTP: Rs 195.8 | Stop-Loss: Rs 203 | Target: Rs 184 | Return: 6 percent
The stock price has broken down from the upward sloping trendline adjoining the lows of February 2, 2023 and September 1, 2023 on the daily chart. Short term trend of the stock is weak as the stock price is placed below its 5, 11 and 20-day EMA.
Momentum Indicators and Oscillators are showing weakness in the stock.

The stock price has broken down on the daily chart by closing below multiple supports of Rs 174-175 odd levels with higher volumes. Short term trend of the stock turned weak as stock price has closed below its important short term moving averages.
RSI Oscillators is sloping downwards and placed below 40 on the daily chart, indicating strength in the downtrend of the stock.
 Disclaimer: The views and investment tips expressed by investment experts on Moneycontrol.com are their own and not those of the website or its management. Moneycontrol.com advises users to check with certified experts before taking any investment decisions.
Discover the latest Business News, Sensex, and Nifty updates. Obtain Personal Finance insights, tax queries, and expert opinions on Moneycontrol or download the Moneycontrol App to stay updated!
Find the best of Al News in one place, specially curated for you every weekend.
Stay on top of the latest tech trends and biggest startup news.