


The market took a breather after a long rally and the benchmark Nifty 50 ended the week down 0.09 percent on January 5, but continued with higher highs, higher lows formation for the sixth week in a row. Overall, the index has been in the range of 21,500-21,850 levels, hence, unless and until it breaks the range on either side, rangebound trade may continue in coming days, experts said.
The in-between hiccups within the last week were firmly seized by the bulls, showing their resilience in not giving up. Also, rotational buying in major sectors kept the trader’s fraternity busy. "The parameters, however, remain overbought, with 21,800-21,850 being the immediate hurdle in the Nifty, followed by 21,900-22,000 for the current week," Sameet Chavan, head of research for technical derivatives at Angel One, said.
While on the downside, "the pivotal support of 21,500 has proved its mettle once in the week and till we sustain above the same, any dips are likely to augur well for the bulls of D-Street," he said.
From a technical standpoint, Jigar S Patel, senior manager of equity research at Anand Rathi, also feels that as long as the index continues to trade above 21,500, the overall trend remains strong. "It would only be considered a trend reversal if the index falls below the 21,500 mark."
On the positive side, he also said there is still potential for the index to reach the resistance level of 22,000, which is indicated by the rising trend line. "Surpassing this level could result in a further rally towards 22,200-22,400 in the current week."
Hence, as the market advances, it is advisable to focus on risk management and have a selective approach while looking out for thematic movers amid the ongoing sectoral rotation, Sameet Chavan said.
Moneycontrol collated a list of top 10 stock ideas from experts with 3-4 weeks perspective. The closing price of December 29 is considered for calculation of stock return:
Expert: Subash Gangadharan, senior technical and derivative analyst at HDFC SecuritiesMotherson Sumi Wiring: Buy | LTP: Rs 65.65 | Stop-Loss: Rs 61 | Target: Rs 72 | Return: 10 percent
Motherson Sumi has shown relative strength last week. While the Nifty has shed 0.09 percent for the week, Motherson Sumi has gained a healthy 5.83 percent. In the process, the stock has closed above its recent trading range on the back of healthy volumes, which augurs well for the uptrend to continue.
Technical indicators are giving positive signals as the stock is trading above the 20 and 50-day SMA (simple moving average). Momentum readings like the 14-week RSI (relative strength index) too are in rising mode and not overbought, which implies potential for further upsides.
With the intermediate technical setup too looking attractive, we expect the stock to move up towards its previous intermediate highs in the coming weeks. Buy between Rs 65-66 levels, with a stop-loss at Rs 61 and target of Rs 72.

Alembic Pharmaceuticals: Buy | LTP: Rs 811.75 | Stop-Loss: Rs 750 | Target: Rs 900 | Return: 11 percent
Alembic is in a strong uptrend. The stock has been continuously making higher tops and higher bottoms over the last several months. Last week, the stock has broken out of a 4 week range on the back of huge volumes.
Technical indicators too are giving positive signals as the stock is trading above the 20 and 50-day SMA. Momentum readings like the 14-week RSI too are in rising mode and not extremely overbought, which implies potential for further upsides.
With the intermediate technical setup too looking attractive, we expect the stock to move up towards its previous intermediate highs in the coming weeks. Buy between Rs 810-814 levels, with a stop-loss at Rs 750 and target of Rs 900.

Godfrey Phillips: Buy | LTP: Rs 2,216.9 | Stop-Loss: Rs 2,070 | Target: Rs 2,400 | Return: 8 percent
After correcting from an intermediate high of Rs 2,405 tested in November 2023, Godfrey Phillips found support around Rs 2,000 levels in November 2023. These are strong supports as they also roughly coincide with previous intermediate lows. The stock has since then bounced back and broken out of its recent trading range on the back of healthy volumes, indicating it is set to move higher in the coming weeks.
Technical indicators are giving positive signals as the stock is trading above the 20 and 50 day SMA. Momentum readings like the 14-week RSI too are in rising mode and not overbought, which implies potential for further upsides.
With the intermediate technical setup too looking attractive, we expect the stock to move up towards its previous intermediate highs in the coming weeks. Buy between Rs 2,208-2,212 levels, with a stop-loss at Rs 2,070 and target at Rs 2,400.
 Expert: Omkar Patil, technical & derivatives analyst - institutional equity at Ashika Group
Info Edge India: Buy | LTP: Rs 5,246.15 | Stop-Loss: Rs 5,035 | Target: Rs 5,730 | Return: 9 percent
Naukri stock has successfully surpassed Rs 5,000 mark, which had been acting as a resistance since February 2022. Notably, there is a discernible shift in polarity at this level, indicative of an overall positive sentiment surrounding the stock. The recent upward movement is noteworthy for being accompanied by a notable increase in trading volumes, suggesting a growing demand for the stock.
Going ahead we expect the prices to move higher till the mark of Rs 5,730 where the stop-loss must be Rs 5,035 on a daily closing basis.

Hindustan Petroleum Corporation: Buy | LTP: Rs 420 | Stop-Loss: Rs 405 | Target: Rs 460 | Return: 9.5 percent
Hindustan Petroleum stock is presently at multi-year high, indicating a robust momentum in its trading. The recent increase in volumes, particularly from the ascending channel support, has provided impetus for the prices to ascend further.
Additionally, the stock is positioned above short-term moving averages, with a positive crossover above the zero-line, signaling the presence of positive momentum in the ongoing trend.
Going ahead we expect the prices to move higher till the mark of Rs 460, where the stop-loss must be Rs 405 on a daily closing basis.

REC: Buy | LTP: Rs 434.30 | Stop-Loss: Rs 415 | Target: Rs 475 | Return: 9.4 percent
REC is currently experiencing an upward trend, with the acceleration of this uptrend evident as the steepness of the trend has steadily increased. The stock has successfully emerged from a narrow consolidation phase, supported by the 12-day exponential moving average (EMA).
Additionally, the relative strength index (RSI) reading above the 50 mark indicates a growing momentum in the trend.
Going ahead, we expect the prices to move higher till the mark of Rs 475, where the stop-loss must be 415 on a daily closing basis.

VA Tech Wabag: Buy | LTP: Rs 647.50 | Stop-Loss: Rs 618 | Target: Rs 715 | Return: 10 percent
The stock exhibits a robust bullish trend evident through the ongoing formation of higher highs and higher lows on the weekly chart. Further supporting its upward trajectory, the stock is currently trading above its 50-day moving average (DMA). The ascending triangle formation observed, adds to the bullish sentiment indicating a potential breakout.
The stock price is above the super trend reinforcing the strength for the upward direction. The Relative Strength Index (RSI) at 61, indicates the sustained upward movement in the stock.
A crucial aspect highlighted by the daily volume profile is the strong support at around Rs 630 levels.
Hence, based on the above technical structure, one can initiate a long position at LTP of Rs. 647.5, for the target price of Rs 715. Stop-loss can be kept at Rs 618.

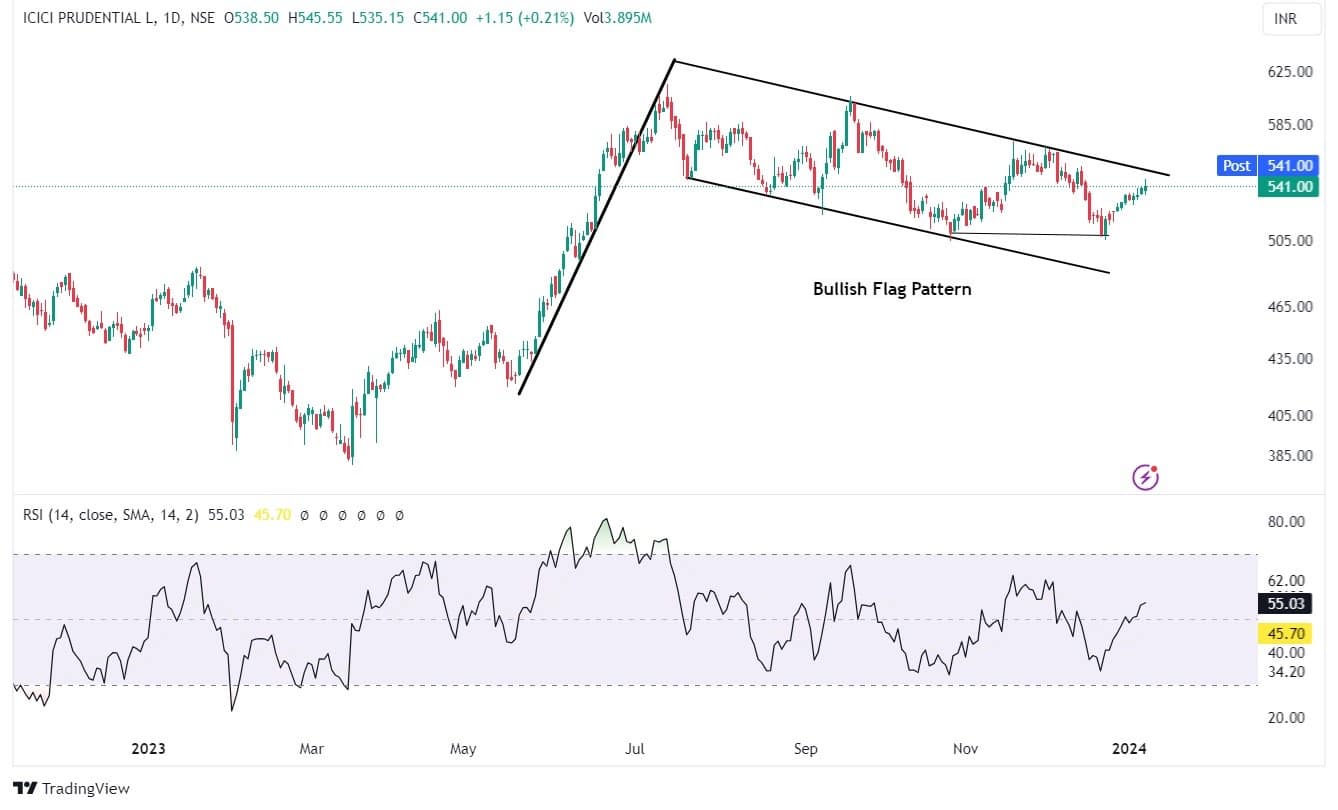
ICICI Prudential Life Insurance Company: Buy | LTP: Rs 541 | Stop-Loss: Rs 512 | Target: Rs 590 | Return: 9 percent
The stock has recently emerged from a period of consolidation marked by higher volumes. Notably, the current price comfortably trades above the 20-day and 50-day moving averages, signaling a positive trend. The Relative Strength Index (RSI) is on an upward trajectory and is steady above the 55 level indicating sustained buying interest.
Elevated volume accompanies a rising price, affirming positive momentum. A confirmed double-bottom pattern adds further support, while the stock consolidates within a flag pattern, signaling a potential breakout.
We anticipate that the stock (LTP Rs 541) to scale higher towards Rs 590. Stop-Losscan be kept at Rs 512.
SBI Card: Buy | LTP: Rs 771.60 | Stop-Loss: Rs 745 | Target: Rs 830 | Return: 7.6 percent
On the daily chart, the stock has formed an Inverse Head and Shoulder chart pattern and it is trading near the neckline resistance zone. The decent volume activity and structure of the stock is indicating fresh leg of upward momentum from current levels in the coming horizon.

HDFC Life Insurance Company: Buy | LTP: Rs 646.75 | Stop-Loss: Rs 620 | Target: Rs 690 | Return: 7 percent
The counter is in the accumulation zone where it is trading in a rangebound mode for the past few sessions. The texture of the chart formation and technical indicator RSI is indicating that the counter is very likely to breakout from rectangle formation for a new leg of the up move in the near term.

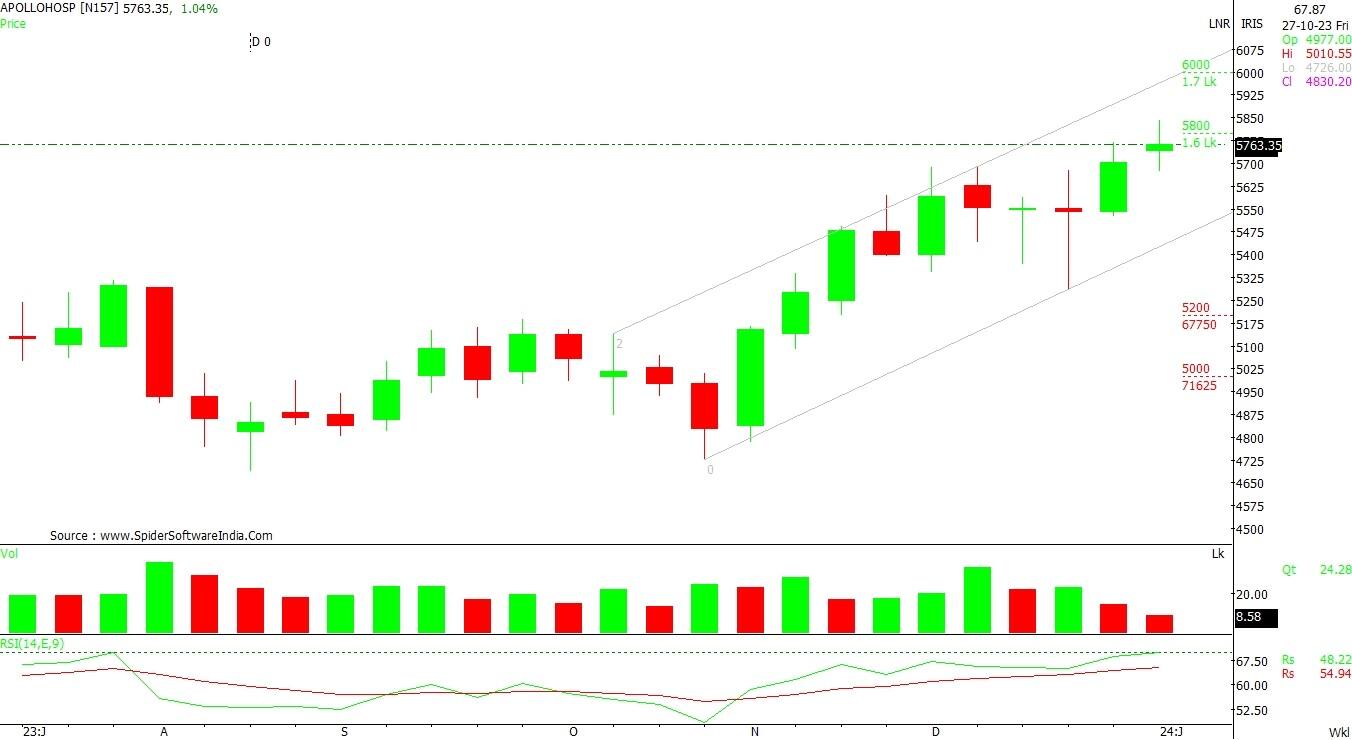
Apollo Hospitals Enterprise: Buy | LTP: Rs 5,754 | Stop-Loss: Rs 5,560 | Target: Rs 6,170 | Return: 7 percent
On the weekly scale, the counter is into a rising channel chart formation with higher high and higher low series pattern. Moreover, the technical indicators like RSI and MACD also indicating further up trend from current levels which could boost the bullish momentum in the near future.
Discover the latest Business News, Sensex, and Nifty updates. Obtain Personal Finance insights, tax queries, and expert opinions on Moneycontrol or download the Moneycontrol App to stay updated!
Find the best of Al News in one place, specially curated for you every weekend.
Stay on top of the latest tech trends and biggest startup news.


