


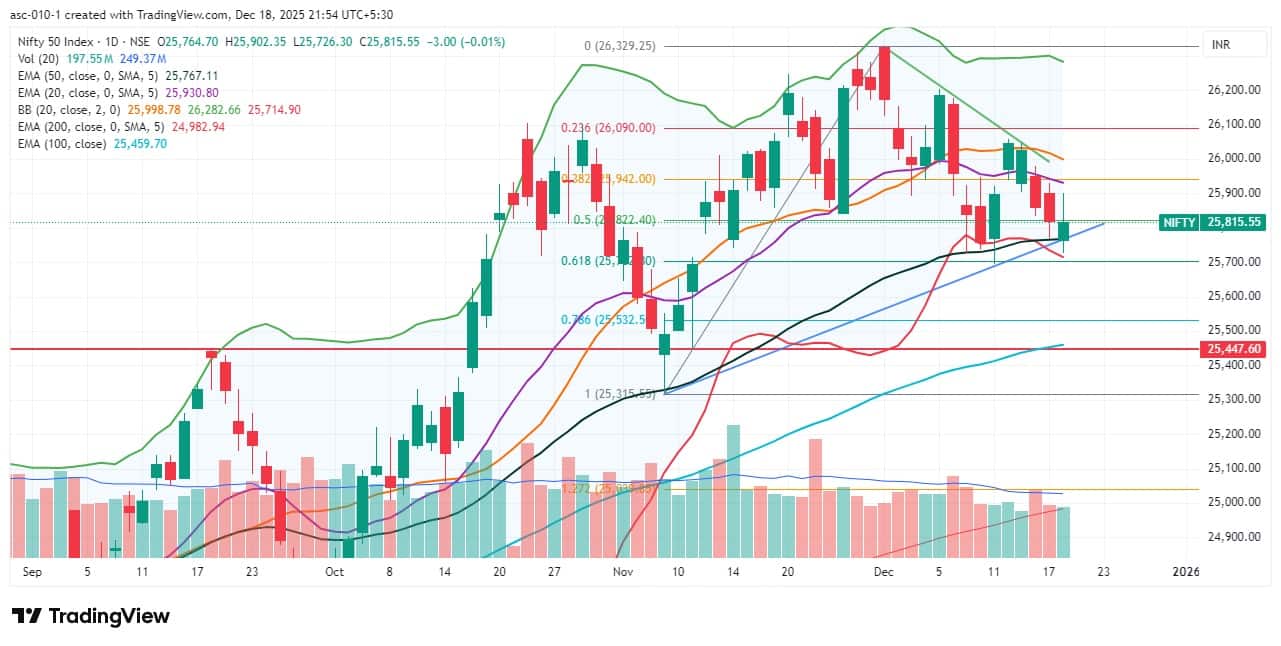
The Nifty 50 failed to sustain its intraday recovery and closed flat with a negative bias, continuing its southward journey and maintaining a lower high–lower low structure for the fourth straight session on December 18. However, it appears to have formed a bullish reversal–type pattern on both the Nifty and the Bank Nifty. The Nifty 50 managed to defend the 50-day EMA as well as the upward-sloping support trendline on a closing basis (both in the 25,750–25,800 range), along with the lower end of the bullish gap zone of November 12 (slightly above 25,700). If the index rebounds, the 25,900–26,000 zone can act as a hurdle on the upside; however, a decisive fall below 25,750–25,700 could open the door to the 25,500–25,450 zone, experts said.
Here are 15 data points we have collated to help you spot profitable trades:
1) Key Levels For The Nifty 50 (25,816)
Resistance based on pivot points: 25,882, 25,924, and 25,991
Support based on pivot points: 25,747, 25,706, and 25,639
Special Formation: The Nifty 50 formed a bullish candle with a long upper shadow and a minor lower shadow, somewhat resembling an inverted hammer–type pattern (though not a classical one) on the daily timeframe, which is generally considered a bullish reversal pattern. The index remained between the short-term and medium-term moving averages on a closing basis. However, the momentum indicators remained bearish, with the RSI falling to 46.37 and the MACD moving down toward the zero line, accompanied by a further decline in the histogram. All this indicates cautious sentiment with limited upside momentum.
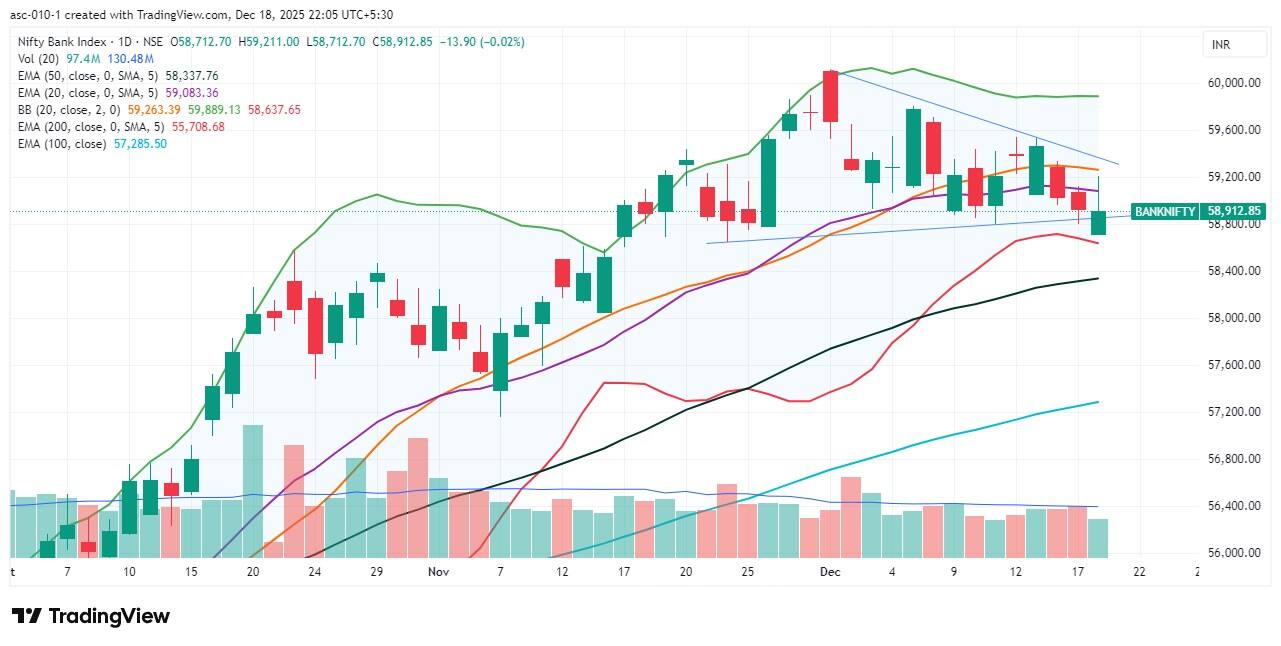
2) Key Levels For The Bank Nifty (58,913)
Resistance based on pivot points: 59,136, 59,253, and 59,444
Support based on pivot points: 58,755, 58,638, and 58,447
Resistance based on Fibonacci retracement: 59,467, 60,895
Support based on Fibonacci retracement: 58,643, 58,296
Special Formation: The Bank Nifty formed a bullish candle with a long upper shadow, resembling an inverted hammer–type pattern on the daily timeframe (which is generally a bullish reversal pattern), indicating that selling pressure may be weakening and that buyers attempted to regain control by testing the 20-day EMA intraday. The index held above the rising support trendline as well as the previous day’s low on a closing basis. However, the momentum indicators remained weak, with the RSI declining to 49.58 and the MACD sustaining below the reference line, along with further weakness in the histogram. All this indicates a tentative stabilization, though momentum confirmation is still lacking.
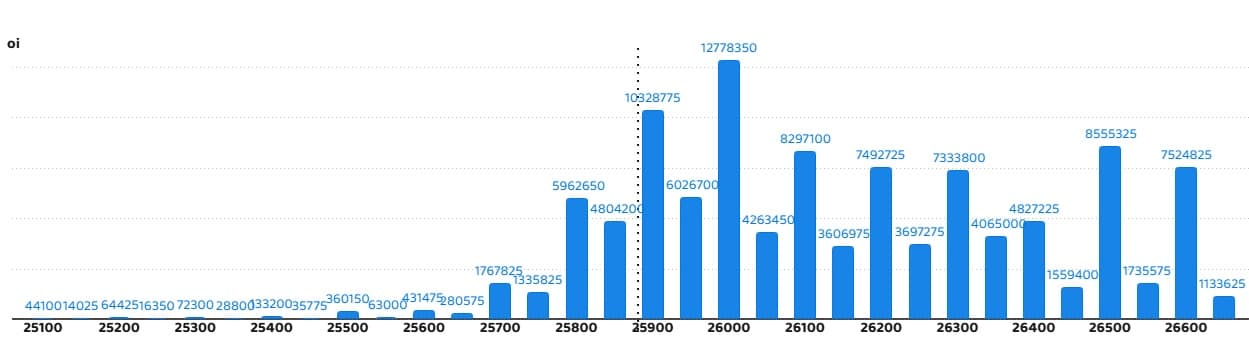
According to the weekly options data, the maximum Call open interest was seen at the 26,000 strike (with 1.27 crore contracts). This level can act as a key resistance level for the Nifty in the short term. It was followed by the 25,900 strike (1.03 crore contracts) and 26,500 strike (85.55 lakh contracts).
Maximum Call writing was observed at the 26,600 strike, which saw an addition of 20.1 lakh contracts, followed by the 25,800 and 26,200 strikes, which added 13.57 lakh and 10.04 lakh contracts, respectively. The maximum Call unwinding was seen at the 26,150 strike, which shed 10.01 lakh contracts, followed by the 26,300 and 26,650 strikes, which shed 8.22 lakh and 3.33 lakh contracts, respectively.
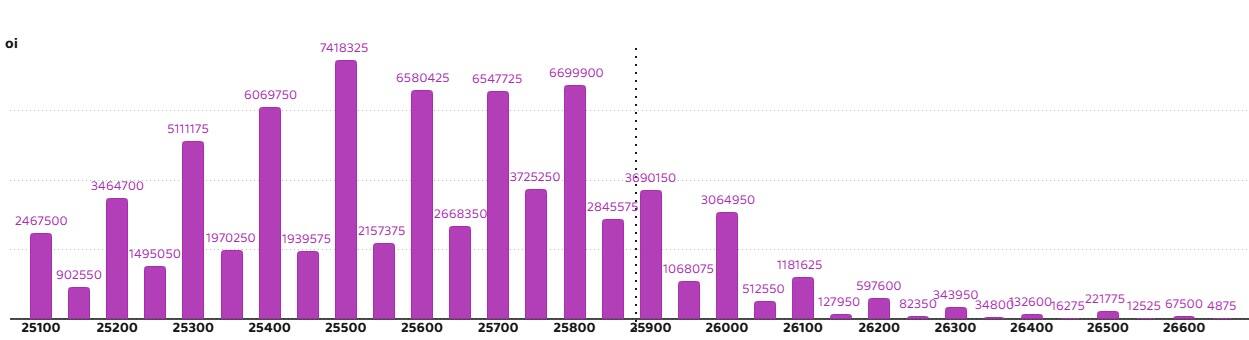
On the Put side, the 25,500 strike holds the maximum Put open interest (with 74.18 lakh contracts), which can act as a key support level for the Nifty in the short term. It was followed by the 25,800 strike (66.99 lakh contracts) and the 25,600 strike (65.8 lakh contracts).
The maximum Put writing was placed at the 25,600 strike, which saw an addition of 30.07 lakh contracts, followed by the 25,700 and 25,400 strikes, which added 20.2 lakh and 16.94 lakh contracts, respectively. The maximum Put unwinding was seen at the 25,350 strike, which shed 10.92 lakh contracts, followed by the 25,900 and 26,100 strikes, which shed 8.03 lakh and 1.44 lakh contracts, respectively.
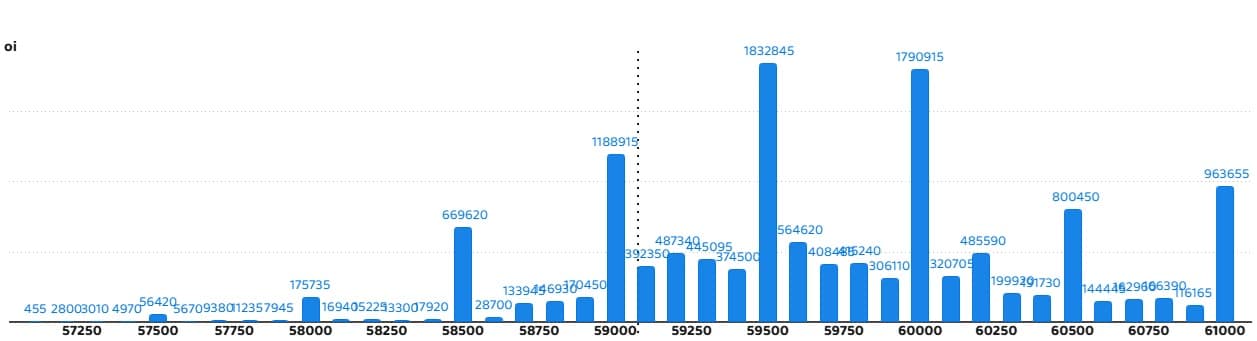
5) Bank Nifty Call Options Data
According to the monthly options data, the 59,500 strike holds the maximum Call open interest, with 18.32 lakh contracts. This can act as a key resistance level for the index in the short term. It was followed by the 60,000 strike (17.9 lakh contracts) and the 59,000 strike (11.88 lakh contracts).
Maximum Call writing was observed at the 60,200 strike (with the addition of 55,475 contracts), followed by the 60,100 strike (32,900 contracts) and 60,300 strike (28,280 contracts). The maximum Call unwinding was seen at the 59,600 strike, which shed 47,425 contracts, followed by the 59,400 and 59,200 strikes, which shed 46,725 and 46,130 contracts, respectively.
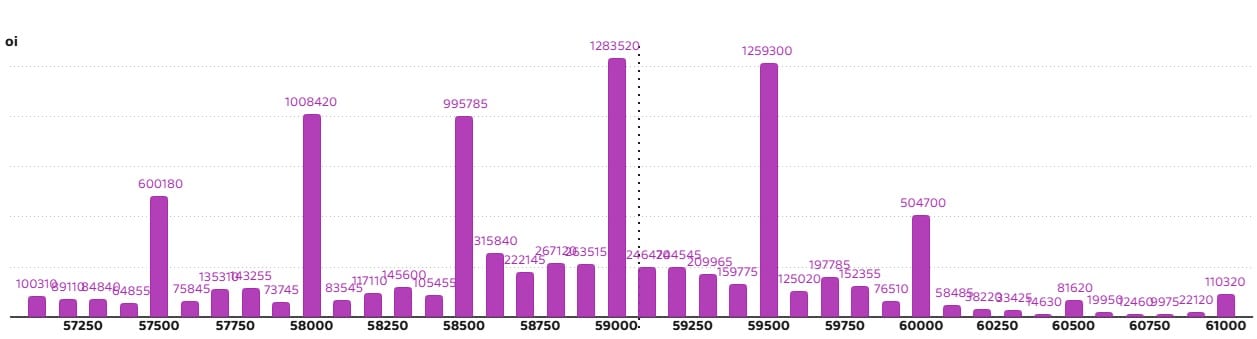
6) Bank Nifty Put Options Data
On the Put side, the maximum Put open interest was seen at the 59,000 strike (with 12.83 lakh contracts), which can act as a key level for the index. This was followed by the 59,500 strike (12.59 lakh contracts) and the 58,000 strike (10.08 lakh contracts).
The maximum Put writing was placed at the 58,700 strike (which added 62,055 contracts), followed by the 58,300 strike (53,410 contracts) and the 58,800 strike (39,795 contracts). The maximum Put unwinding was seen at the 59,500 strike, which shed 2.2 lakh contracts, followed by the 58,000 and 57,500 strikes, which shed 1.02 lakh and 70,770 contracts, respectively.
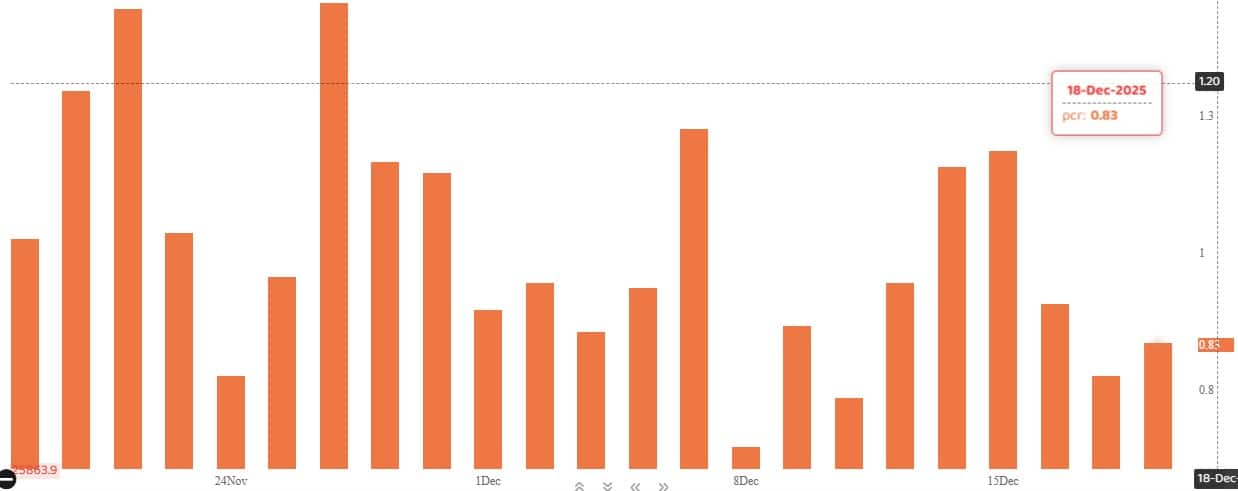
The Nifty Put-Call ratio (PCR), which indicates the mood of the market, rose to 0.83 on December 18, compared to 0.77 in the previous session.
The increasing PCR, or being higher than 0.7 or surpassing 1, means traders are selling more Put options than Call options, which generally indicates the firming up of a bullish sentiment in the market. If the ratio falls below 0.7 or moves towards 0.5, then it indicates selling in Calls is higher than selling in Puts, reflecting a bearish mood in the market.
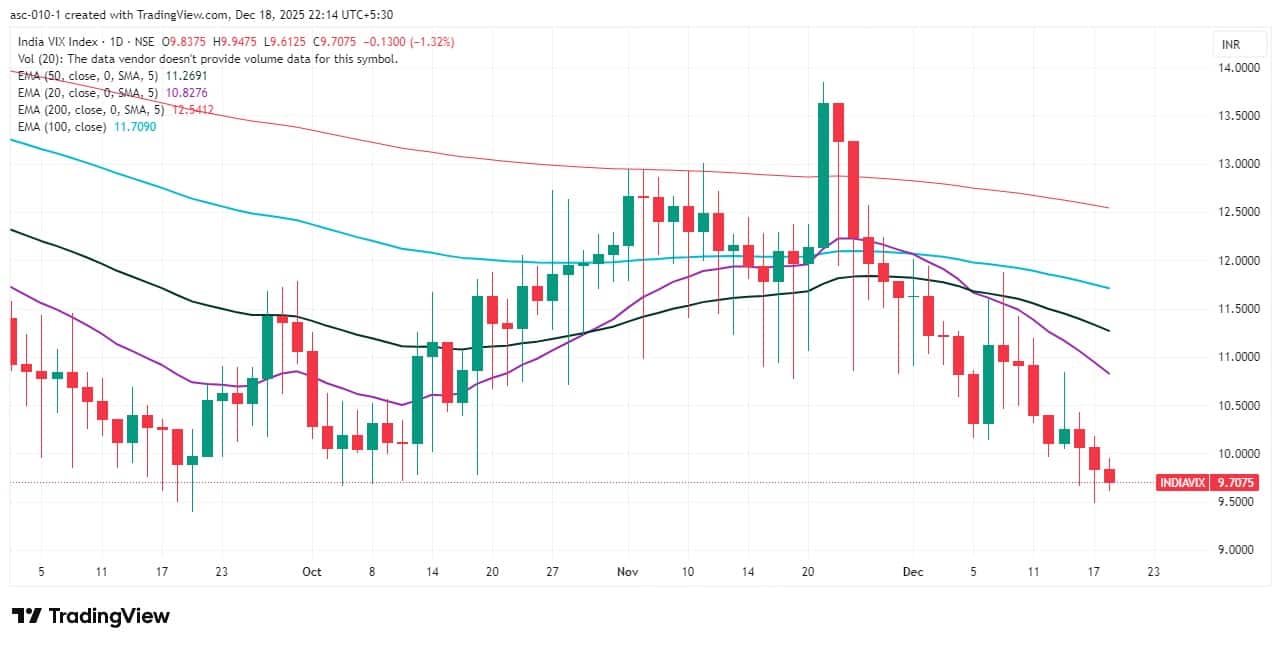
9) India VIX
The India VIX, also known as the fear gauge, declined for the third consecutive session, falling 1.32 percent to 9.7, marking a new closing low on Thursday and favouring bulls. Generally, volatility at such lower levels also signals the possibility of a sharp market move in the near term.
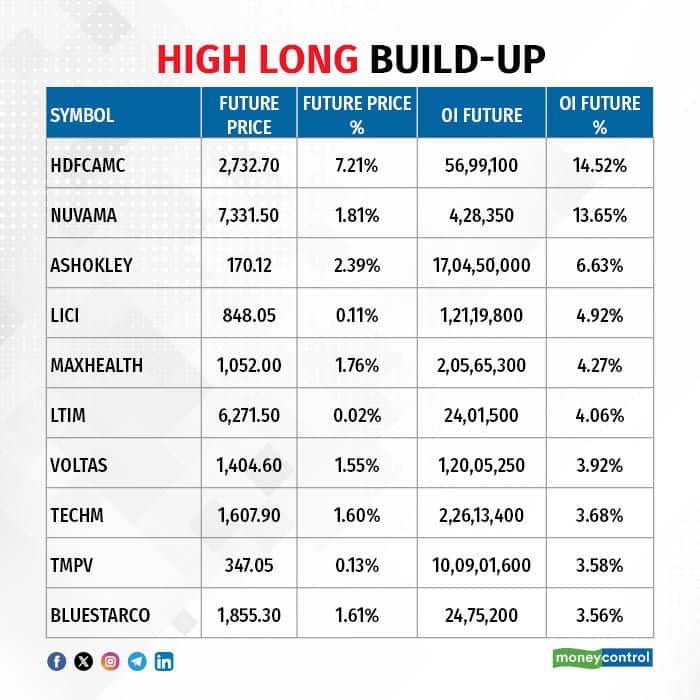
A long build-up was seen in 58 stocks. An increase in open interest (OI) and price indicates a build-up of long positions.
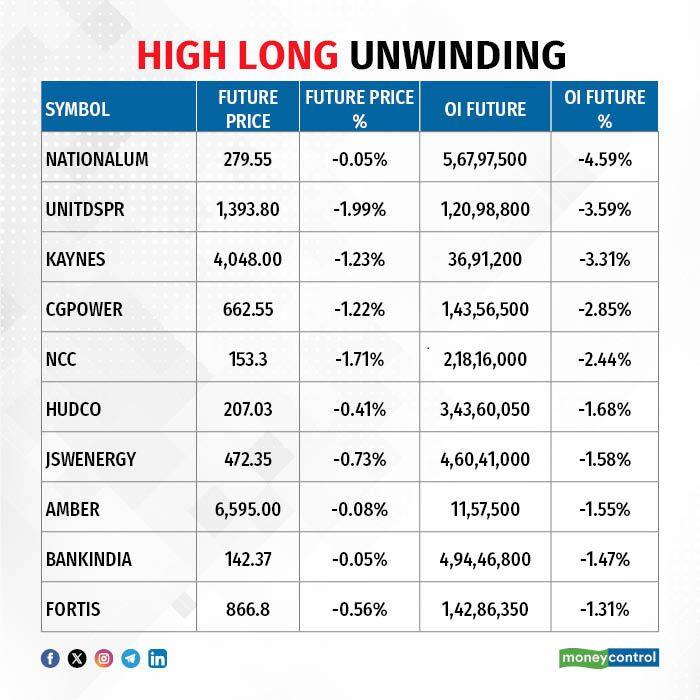
11) Long Unwinding (27 Stocks)
27 stocks saw a decline in open interest (OI) along with a fall in price, indicating long unwinding.
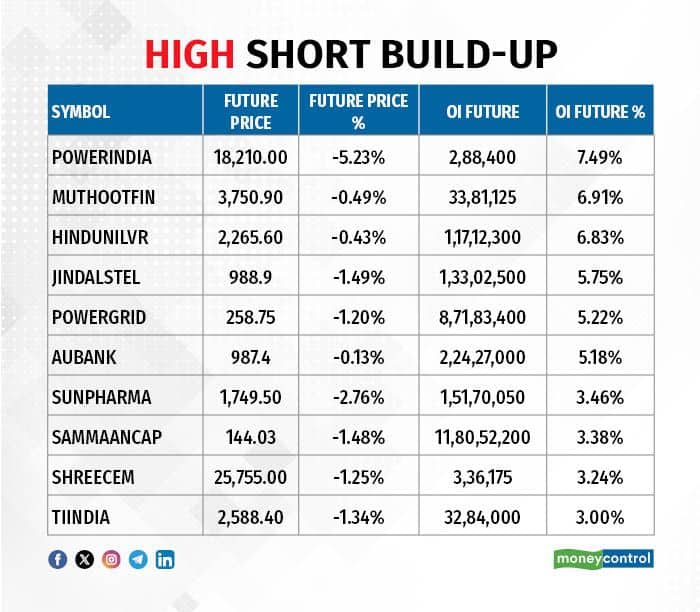
12) Short Build-up (83 Stocks)
83 stocks saw an increase in OI along with a fall in price, indicating a build-up of short positions.
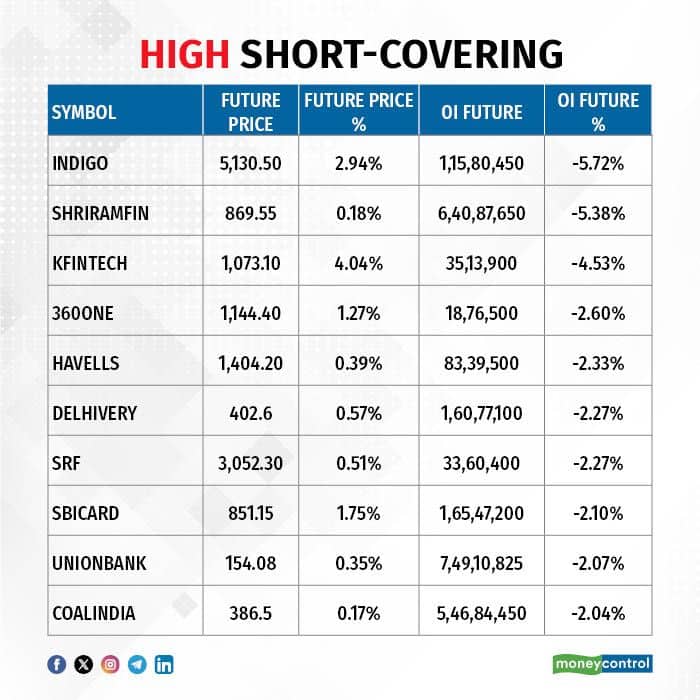
13) Short-Covering (45 Stocks)
45 stocks saw short-covering, meaning a decrease in OI, along with a price increase.
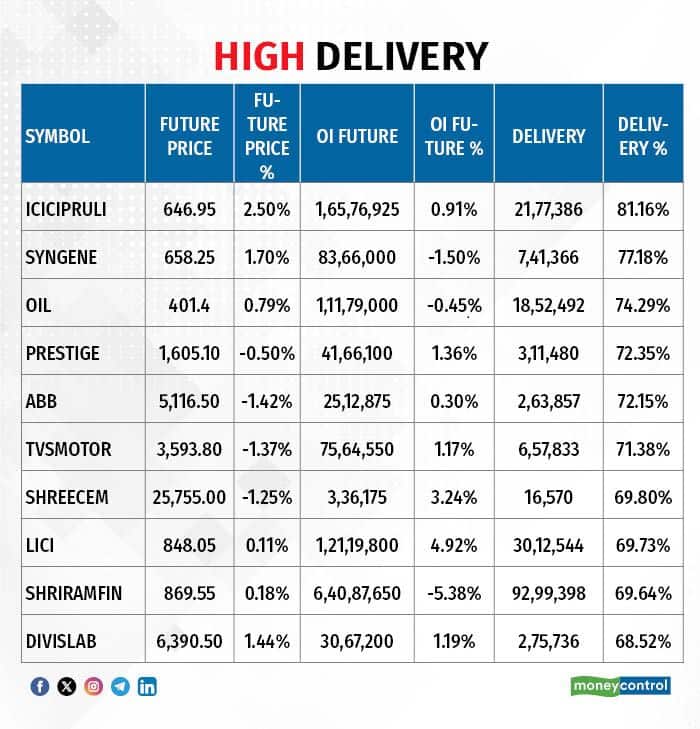
Here are the stocks that saw a high share of delivery trades. A high share of delivery reflects investing (as opposed to trading) interest in a stock.
Securities banned under the F&O segment include companies where derivative contracts cross 95 percent of the market-wide position limit.
Stocks added to F&O ban: Sammaan Capital
Stocks retained in F&O ban: Nil
Stocks removed from F&O ban: Bandhan Bank
Disclaimer: The views and investment tips expressed by experts on Moneycontrol are their own and not those of the website or its management. Moneycontrol advises users to check with certified experts before taking any investment decisions.Disclaimer: Moneycontrol is a part of the Network18 group. Network18 is controlled by Independent Media Trust, of which Reliance Industries is the sole beneficiary.Discover the latest Business News, Sensex, and Nifty updates. Obtain Personal Finance insights, tax queries, and expert opinions on Moneycontrol or download the Moneycontrol App to stay updated!
Find the best of Al News in one place, specially curated for you every weekend.
Stay on top of the latest tech trends and biggest startup news.


