


After decisively surpassing the previous record highs and making a higher-high-higher-low formation along with healthy volumes on the daily charts last week, the Nifty50 seem to be on course to scale the 20,400-20,500 level as a resistance in coming sessions, with support at 20,200-20,000 zone, experts said. However, after meeting this zone on the higher side, the market may see some profit-taking and consolidation before getting into the mood for another leg of rally, according to the experts.
The BJP victory in three states out of four that declared results on December 3 increased hopes for policy and reforms continuation at the Centre after the general elections next year, and ended the uncertainty related to elections and further boosted the confidence among market participants in addition to already getting positive vibes on the global front.
Read | BJP’s election sweep calms populism fears, allays market concerns about political risks
For the week ended December 1, the Nifty50 jumped 2.4 percent, the biggest weekly gains since June this year, to end at fresh record closing high of 20,268 and formed long bullish candlestick pattern on the weekly charts. The index continued uptrend for fifth consecutive session with good volumes and moved into uncharted territory.
"The support zone has seen a strong upliftment starting from 20,150-20,100, followed by 20,000-19,950 for the current week. While on the higher end, amid favourable conditions, the Nifty seems potent to test 20,400 - 20,500 in the comparable period," Osho Krishan, senior analyst - technical and derivative research at Angel One, said.
Pravesh Gour, senior technical analyst at Swastika Investmart also believes the Nifty effortlessly surpassing previous record high is an indication of a continuation of this momentum where 20,500 looks like an immediate target. On the downside, "20,125-20,000 is an immediate support zone, and 19,800–19,600 are key support levels at any pullback", he said.
Hence, going forward, experts expect any dips to augur well for the bulls. Also, "along with the heavyweights, the mid and small-cap counters are keeping up the buzz and may continue to do so," Osho said.
Also read | BJP victory may boost bank, industrial, power, property sectors: Jefferies
Let's take a look at the top 10 trading ideas from experts for the next three-four weeks. Returns are based on the December 1 closing prices.
Expert: Viraj Vyas, CMT, Technical & Derivatives Analyst | Institutional Equity at Ashika Stock Broking
Astral: Buy | LTP: Rs 1,978 | Stop-Loss: Rs 1,880 | Target: Rs 2,200 | Return: 11 percent
The stock, which was in a time corrective mode since June 2023, has recently shown signs of a strong bullish impulse. Breaking above the downward sloping trendline and closing above the two-month high on Friday are positive signals.
The supportive volumes further suggest a potential end to the correction phase, paving the way for an impulse move towards Rs 2,180-2,200 levels. Investors may want to keep an eye on this stock for potential trading opportunities.

Tata Power: Buy | LTP: Rs 276 | Stop-Loss: Rs 262 | Target: Rs 306 | Return: 11 percent
The stock has been undergoing an extended phase of time correction since October 2021, with prices ranging between Rs 275 and Rs 200. The formation of a Cup and Handle Pattern, accompanied by strong rising price bars and high-volume activity, suggests a potential breakout.
If the stock manages to break above Rs 277-278 levels, it could mark the beginning of the next bullish impulse for this stock. Investors may want to monitor this breakout for potential trading opportunities.
ICICI Lombard General Insurance Company: Buy | LTP: Rs 1,457 | Stop-Loss: Rs 1,380 | Target: Rs 1,625 | Return: 11 percent
The stock has not been an impressive performer since the corrective move that occurred in late 2021. However, it has been in a phase of time correction since April 2023, finding support at Rs 1,080-1,100 levels. The recent impressive range expansion on the bullish side, combined with a multi-month bullish breakout, suggests a shift in sentiment.
The volume participation during this breakout indicates the potential end of the time correction and the beginning of a new bullish price impulse for the stock.
Expert: Vinay Rajani, senior technical and derivative analyst at HDFC Securities
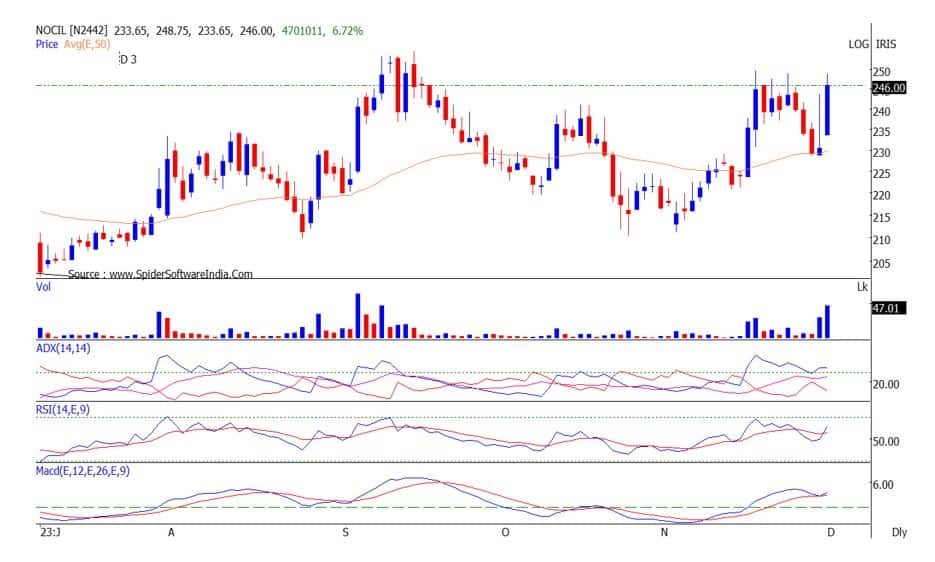
NOCIL: Buy | LTP: Rs 246 | Stop-Loss: Rs 228.8 | Target: Rs 270-290 | Return: 18 percent
The stock price has formed bullish Inverted Head and Shoulder pattern on the daily chart and on the verge of breaking out from the neckline. On December 1, 2023, the stock surged more than 6 percent with jump in volumes.
The stock recently found support on 50 DEMA and bounced back. It is holding above its 20, 50, 100 and 200 DEMA (exponential moving average), which indicates bullish trend on all time frame. Indicators and Oscillators like DMI (directional movement index) and RSI (relative strength index) have turned bullish on the daily charts.
GSFC: Buy | LTP: Rs 193.7 | Stop-Loss: Rs 179 | Target: Rs 214-235 | Return: 21 percent
Gujarat State Fertilizers & Chemicals stock has broken out from bullish “Flag” pattern on the weekly chart. Price breakout is accompanied with jump in volumes.
The stock has been finding support on 50 DEMA, currently placed at Rs 183 odd levels. Stock is placed above all important moving averages, indicating bullish trend on all time frames. Indicators and oscillators have turned bullish on weekly time frame.
Bank of India: Buy | LTP: Rs 107.50 | Stop-Loss: Rs 102 | Target: Rs 125 | Return: 16 percent
The stock price has been finding support on its 20-day EMA, currently placed at Rs 104. Primary trend for the stock has been bullish as it has been trading above all important moving averages.
The stock price has formed bullish Inverted Head and Shoulder pattern on the daily chart. Indicators and oscillators like DMI and RSI have turned bullish on the daily charts. PSU Bank Index has resumed its primary uptrend after small consolidation.
Expert: Mehul Kothari, DVP – Technical Research at Anand Rathi
ICICI Bank: Buy | LTP: Rs 946.7 | Stop-Loss: Rs 899 | Target: Rs 1,001-1,022 | Return: 8 percent
We are bullish on Nifty Bank index for the coming few weeks and ICICI Bank is a major part of the index. The peers of ICICI Bank like Axis Bank and IndusInd Bank underwent a decent rally in the past few sessions, and we expect the same in ICICI Bank.
As of now, the stock has confirmed a falling trendline breakout just above the placement of 200 DEMA.
Thus, traders are advised to buy ICICI Bank in the range of Rs 945 - 935 with a stop-loss of Rs 899 on closing basis for an upside target of Rs 1,001 and Rs 1,022 in coming 1 – 2 months.
Rolex Rings: Buy | LTP: Rs 2,451 | Stop-Loss: Rs 2,300 | Target: Rs 2,700 | Return: 10 percent
Rolex Rings has been consolidating in a broad range since quite some time and in Friday’s session it has confirmed a breakout from that band.
The price action is supported with decent volumes and also the daily ADX (average directional index) is about to come out of 20 level and that indicates strength.
Thus, traders are advised to buy Rolex Rings near Rs 2,450 with a stop-loss of Rs 2,300 on closing basis for an upside target of Rs 2,700 in coming 1 – 2 months.
ITC: Buy | LTP: Rs 450 | Stop-Loss: Rs 434 | Target: Rs 470 | Return: 4.4 percent
After almost 5 months of rangebound activity we have witnessed a considerable move in ITC and that too on the upside.
The stock is already in a strong up trend on the long term scale and has now confirmed a fresh breakout. This indicates that the TIGER is awake.
Thus, traders are advised to buy ITC near Rs 446 with a stop-loss of Rs 434 on closing basis for an upside target of Rs 470 in coming 1 – 2 months.

Expert: Mitesh Karwa, Research Analyst at Bonanza Portfolio
Max Healthcare Institute: Buy | LTP: Rs 652 | Stop-Loss: Rs 620 | Target: Rs 700 | Return: 7 percent
Max Healthcare has seen breaking out of a bullish pattern on the weekly timeframe with a bullish candlestick and above average volume which indicates strength as the stock is also trading above all its important EMAs on the daily timeframe which acts as a confluence.
The Supertrend indicator is also indicating a bullish continuation which supports the bullish view. Momentum oscillator RSI (14) is at around 71 on the daily time frame indicating strength by sustaining above 50. And the Ichimoku cloud is also suggesting a bullish move as the price is trading above the conversion line, base line and cloud.
Observation of the above factors indicates that a bullish move in Max Healthcare is possible for target upto Rs 700. One can initiate a buy trade in between the range of Rs 650-652, with a stop-loss of Rs 620 on daily closing basis.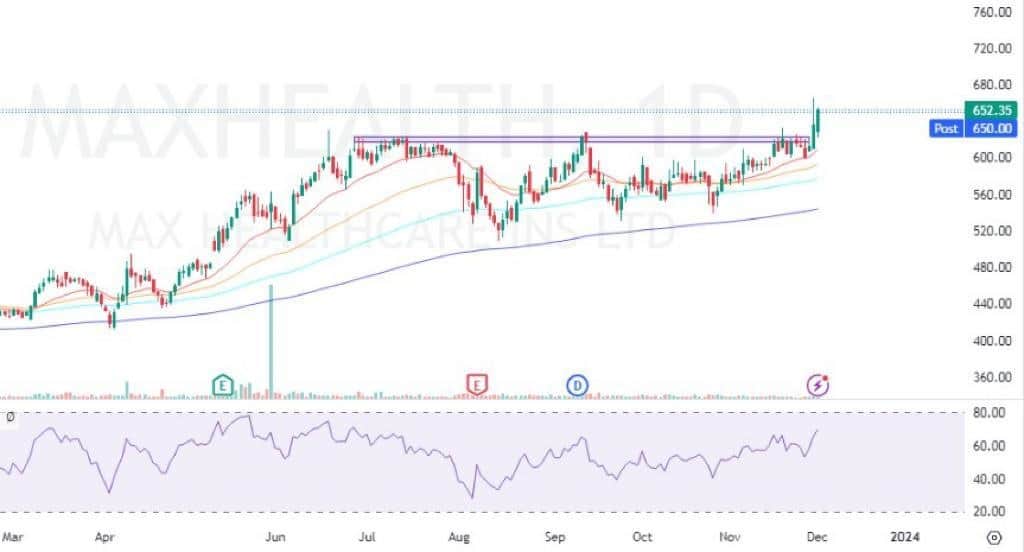
Disclaimer: The views and investment tips expressed by investment experts on Moneycontrol.com are their own and not those of the website or its management. Moneycontrol.com advises users to check with certified experts before taking any investment decisions.
Discover the latest Business News, Sensex, and Nifty updates. Obtain Personal Finance insights, tax queries, and expert opinions on Moneycontrol or download the Moneycontrol App to stay updated!
Find the best of Al News in one place, specially curated for you every weekend.
Stay on top of the latest tech trends and biggest startup news.


