


Despite sell-off in the banking and financial space following RBI move to put a leash on unsecured lending, the market stayed undeterred and kept up the bullish momentum till the end of the third straight week on November 17. The week also saw it scale the October highs.
Given the formation of the bullish candlestick pattern with higher highs, higher lows for the second straight week, and staying above the downward sloping resistance trendline, the Nifty50 is likely to sustain the upward bias amid consolidation and any dips would be a buying opportunity with support at 19,300, experts said.
During the week, the Nifty50 gained 1 percent to Rs 19,732, with trading above 20-week EMA (exponential moving average) of 19,368.
"Technically speaking, the recent developments construe a robust setup on the price charts for Nifty, and as we move ahead, it is anticipated to have a follow-up move. Also, the breakout of the sloping trendline and the re-testing of the swing high portrays the bullish undertone," Osho Krishan, senior analyst - technical and derivative research at Angel One, said.
On the technical levels front, he feels the 19,650-19,620 zone is likely to cushion short-term blips while the sacrosanct support shifts to the bullish gap of 19,580-19,500. On the higher end, 19,850-19,900 holds intermediate resistance and a decisive move beyond that could trigger the next leg of rally to test the ATH (all-time high) zone in the comparable period, he said.
Rupak De, senior technical analyst at LKP Securities, too, feels the trend is expected to stay positive as the Nifty consistently concludes trading sessions above the critical moving averages. "Support levels are seen at 19,630/19,500 on the lower end, while resistance is placed at 19,850/ 20,000 on the higher end," he said.
The broader markets traded strong compared to benchmarks, with the Nifty Midcap 100 index rising 2 percent to end at record closing high and Nifty Smallcap 100 index climbing 3.9 percent to see record closing high.
"We expect strong moves in the broader market; hence, one needs to have a stock-centric approach for better trading opportunities," Osho said.
Let's take a look at the top 10 trading ideas from experts for the next three-four weeks. Returns are based on the November 17 closing prices.
Expert: Viraj Vyas, CMT, Technical & Derivatives Analyst - Institutional Equity at Ashika Stock Broking
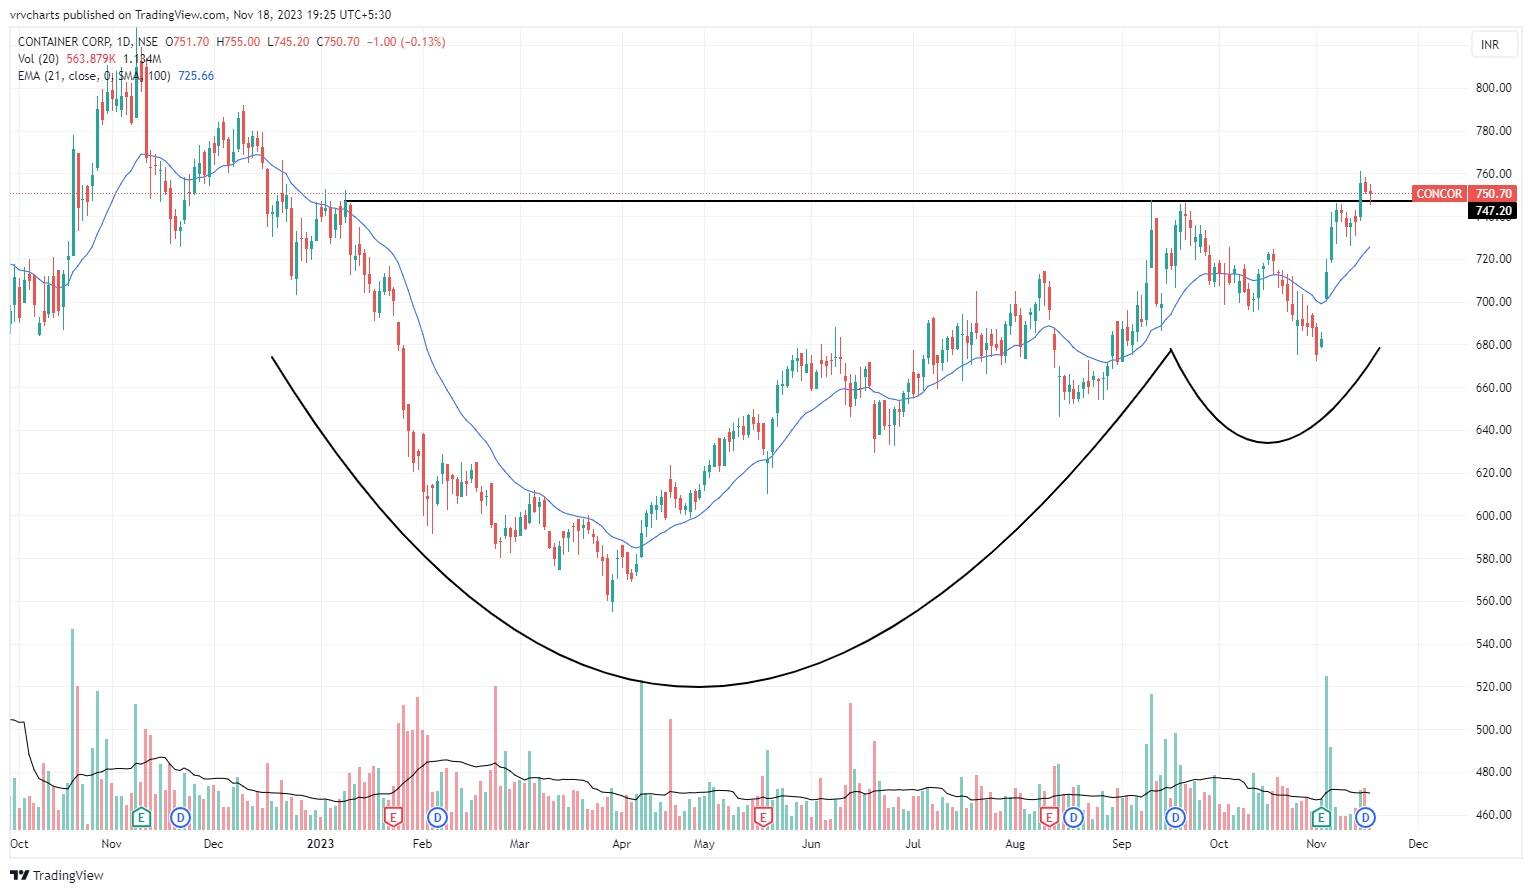
Container Corporation of India: Buy | LTP: Rs 752.65 | Stop-Loss: Rs 710 | Target: Rs 830 | Return: 10 percent
The stock appears to be in a phase of time correction, forming a higher high and higher low structure over the past three weeks on the larger degree chart.
On the daily chart, a Cup and Handle pattern has emerged, suggesting possible accumulation during the consolidation phase. A notable development is the breakout above the neckline at Rs 747. Sustaining more time above this level could increase the likelihood of a bullish impulsive move commencing.
Varroc Engineering: Buy | LTP: Rs 554.75 | Stop-Loss: Rs 525 | Target: Rs 615 | Return: 11 percent
The stock has been in a severe downtrend since its listing, but since 2020, it has been undergoing a phase of time and price consolidation that appears to be on the verge of completion.
A significant development is the breakout above the critical resistance level of Rs 525, supported by strong price action and volumes. Sustaining above this level could potentially signal the commencement of an impulsive move to the upside.
Traders and investors may watch for continued strength and monitor the sustainability of the breakout.

PI Industries: Buy | LTP: Rs 3,726.50 | Stop-Loss: Rs 3,540 | Target: Rs 4,100 | Return: 10 percent
The stock has been in a strong uptrend for most of its history, experiencing a phenomenal run from the lows of 2020 to the highs in September 2022. Subsequently, it entered a phase of consolidation, forming an Ascending Triangle pattern.
Despite a breakout observed in June 2023, the stock retraced back to the breakout level of Rs 3,500-3,530. After consolidating at this level, the stock appears to be gearing up for another impulsive upmove.
Traders and investors may monitor the stock for signs of strength and potential continuation of the bullish trend.

Expert: Jigar S Patel, Senior Manager - Equity Research at Anand Rathi
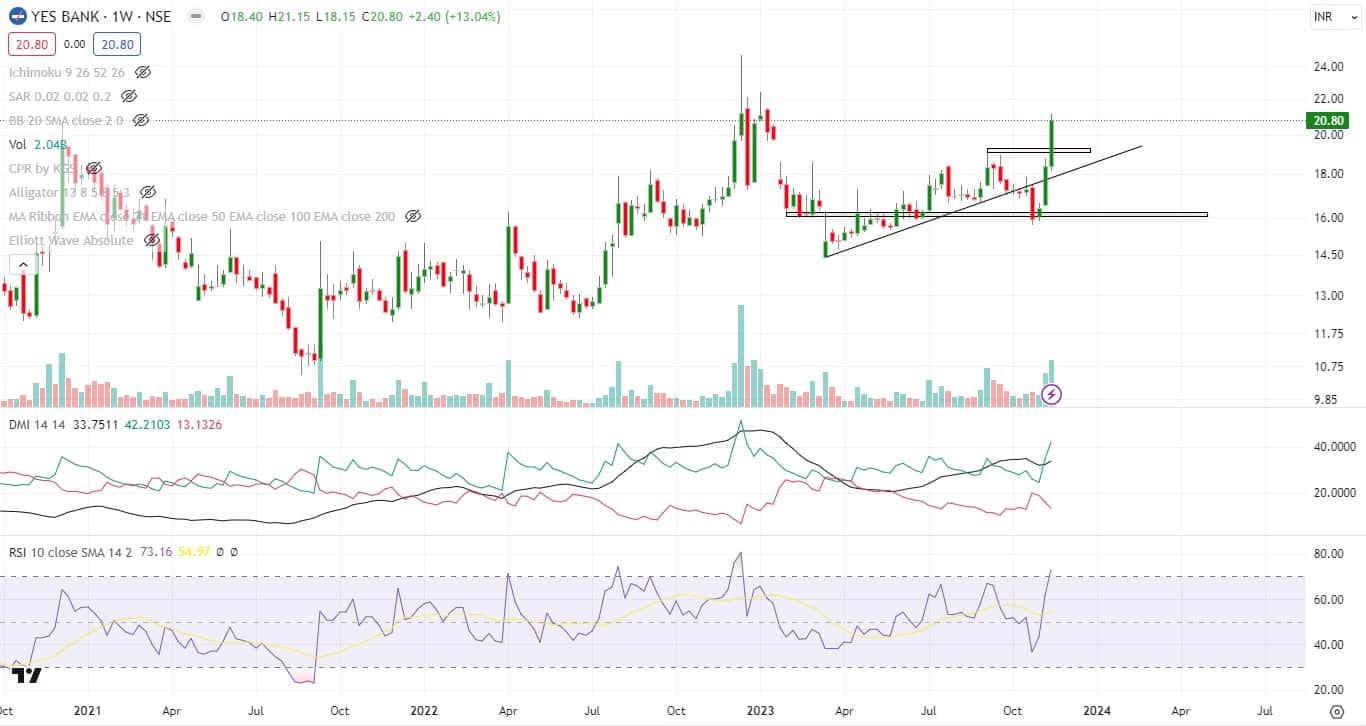
Yes Bank: Buy | LTP: Rs 20.80 | Stop-Loss: Rs 17 | Target: Rs 27 | Return: 30 percent
Since the last couple of weeks, Yes Bank has gained some quick momentum and placed near the Rs 20 mark. Recently, it took out its previous swing with huge volume and successfully sustained above it.
On the indicator front, daily DMI (directional movement index) and RSI (relative strength index) are hinting at a bullish bias in the counter. Thus, one can buy in the range of Rs 20–21 for a target of Rs 27 and a stop-loss of Rs 17 on a daily close basis.
Aarti Industries: Buy | LTP: Rs 526.75 | Stop-Loss: Rs 485 | Target: Rs 600 | Return: 14 percent
For the last two months, the counter has been under selling pressure. There is massive support near Rs 485–495 in the form of a monthly central pivot range.
On the indicator front, weekly DMI’s have given a bullish cross, which further hints towards a bullish bias in the counter. One can buy in the zone of Rs 520–530, and the target would be Rs 600 and the stop-loss would be Rs 485 on a daily close basis.

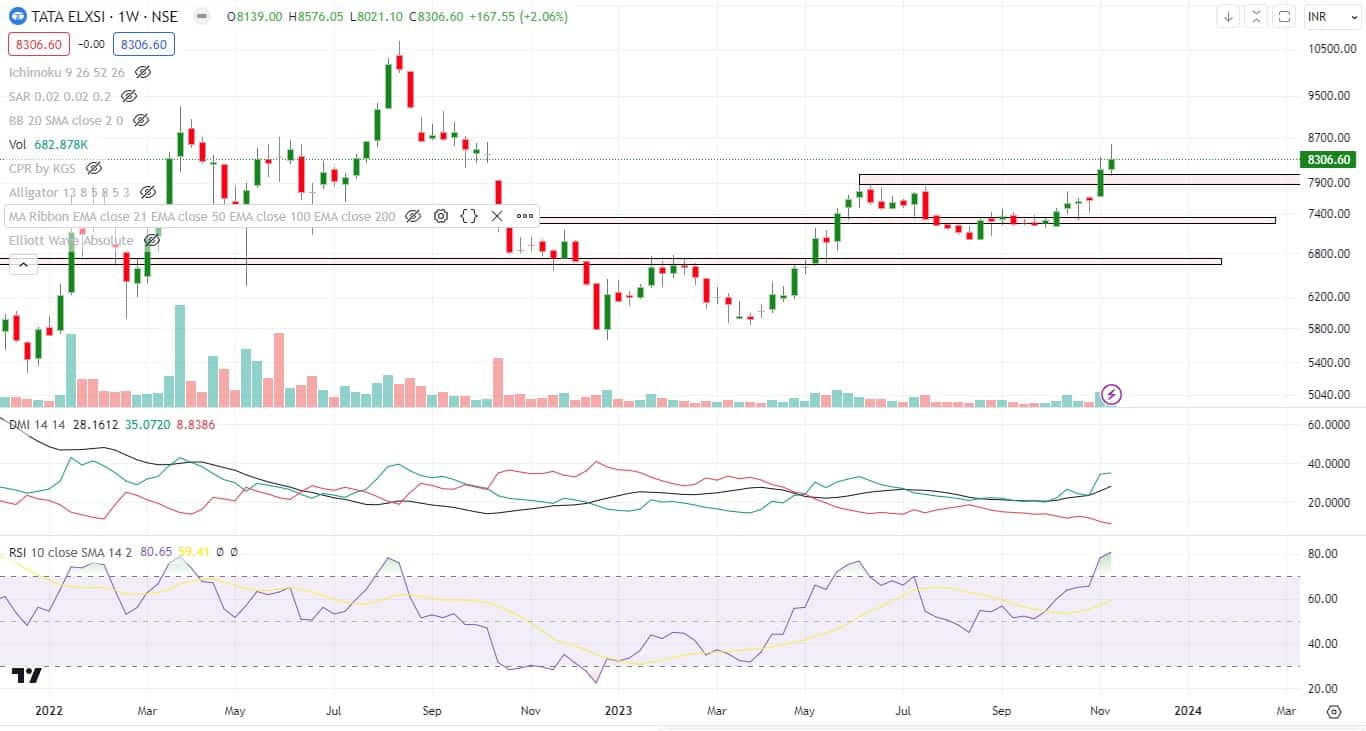
Tata Elxsi: Buy | LTP: Rs 8,306.6 | Stop-Loss: Rs 7,950 | Target: Rs 9,000 | Return: 8 percent
Since the last 2 months or so, the said counter has made a nice base near the 100 daily exponential average. At the current juncture, it has given a breakout on a weekly scale and sustained above its previous swing high of Rs 7,885.
On the indicator front, the weekly RSI has entered above 70 levels, along with an ongoing positive cross on weekly DMI's, which is looking lucrative. Thus, one can buy in the range of Rs 8,250–8,350 with an upside target of Rs 9,000 and a stop-loss of Rs 7,950 on a daily close basis.
Expert: Nagaraj Shetti, technical research analyst at HDFC Securities
ICICI Lombard General Insurance Company: Buy | LTP: Rs 1,446 | Stop-Loss: Rs 1,340 | Target: Rs 1,570 | Return: 8.6 percent
After showing a larger consolidation pattern in the last few months, the stock price has witnessed a decisive upside breakout on Friday at Rs 1,420 levels and is currently trading higher. Hence, there is a higher possibility of further extension of upside momentum in the coming week.
Volume has started to expand during upside breakout in the stock price and weekly 14 period RSI shows positive indication. Present weekly chart pattern is also indicating an upside breakout of bullish flag pattern, which is an uptrend continuation pattern.
Hence, one may expect further strengthening of upside momentum in the stock price ahead.
Buying can be initiated in ICICI Lombard at CMP (Rs 1,446), one may look to add more on dips down to Rs 1,390, wait for the upside target of Rs 1,570 in the next 3-5 weeks. Place a stop-loss of Rs 1,340.

PB Fintech: Buy | LTP: Rs 802.7 | Stop-Loss: Rs 740 | Target: Rs 870 | Return: 8.4 percent
The sharp weakness of October month seems to have reversed sharply on the upside for the stock price-PB Fintech, as per weekly timeframe chart. After showing a false downside breakout of weekly 10/20 period EMA in last month, the stock price has bounced back strongly on the upside so far this month.
Positive chart pattern like higher tops and bottoms is intact and the recent swing low of Rs 661.30 in later part of October could now be considered as a new higher bottom of the sequence.
Weekly 14 period RSI has turned just above the crucial upper 60 levels. This is signaling that the upside momentum could be strengthened further.
One may look to buy PB Fintech at CMP (Rs 802.7), add more on dips down to Rs 765 and wait for the upside target of Rs 870 in the next 3-5 weeks. Place a stop-loss of Rs 740.

Expert: Mitesh Karwa, research analyst at Bonanza Portfolio
SBI Life Insurance Company: Buy | LTP: Rs 1,414 | Stop-Loss: Rs 1,370 | Target: Rs 1,515 | Return: 7 percent
SBI Life has seen breaking out of a resistance zone on the weekly timeframe after more than one year with a bullish candlestick and above average volumes. In addition, the stock is trading and sustaining above all its important EMAs (exponential moving average) which can be used as a confluence towards the bullish view.
On the indicator front, the Ichimoku Cloud is also suggesting a bullish move as the price is trading above the conversion line, base line and cloud. Momentum oscillator RSI (14) is at around 67 on the daily time frame indicating strength by sustaining above 50.
Observation of the above factors indicates that a bullish move in SBI Life is possible for target upto Rs 1,515. One can initiate a buy trade in between the range of Rs 1,410-1,413, with a stop-loss of Rs 1,370 on daily closing basis.

Arvind Fashions: Buy | LTP: Rs 413 | Stop-Loss: Rs 379 | Target: Rs 475 | Return: 15 percent
Arvind Fashions has seen breaking out of a bullish pattern on the weekly timeframe with above average volumes and a bullish candlestick on the daily timeframe. In addition, the stock is trading above important EMAs of 20/50/100/200 on the daily timeframe which indicates strength.
On the indicator front, momentum oscillator RSI (14) is at around 74 on the daily time frame indicating strength by sustaining above 50 and the Ichimoku Cloud is also suggesting a bullish move.
Observation of the above factors indicates that a bullish move in Arvind Fashions is possible for target upto Rs 475. One can initiate a buy trade in the range of Rs 412-413, with a stop-loss of Rs 379 on daily closing basis.

Disclaimer: The views and investment tips expressed by investment experts on Moneycontrol.com are their own and not those of the website or its management. Moneycontrol.com advises users to check with certified experts before taking any investment decisions.
Discover the latest Business News, Sensex, and Nifty updates. Obtain Personal Finance insights, tax queries, and expert opinions on Moneycontrol or download the Moneycontrol App to stay updated!
Find the best of Al News in one place, specially curated for you every weekend.
Stay on top of the latest tech trends and biggest startup news.


