


As the calendar inches closer to 2025, readers are busy evaluating sectors that could drive the next wave of growth. The BSE Capital Goods Index stands out among the potential frontrunners, having delivered stellar returns since 2020. This sector has consistently closed each year with double-digit returns, and 2024 appears to be no different. With the index already up by approximately 30 percent as of December 6, optimism is high for the coming year.
Can the rally in Capital Goods stocks sustain its momentum in 2025?To address this, let us analyse the Ratio Chart of BSE Capital Goods (BSE CG) against the Sensex, a critical tool for identifying sectoral strength relative to the broader market.
Understanding Ratio ChartsA Ratio Chart compares the performance of two assets or indices. In our case, the BSE CG/Sensex Ratio Chart measures the outperformance or underperformance of the Capital Goods sector relative to the Sensex. When the ratio chart trends upward, the Capital Goods sector outperforms the broader market.
This approach is instrumental in identifying sectors that are gaining strength and have the potential to lead market rallies.
BSE CG/Sensex Ratio Chart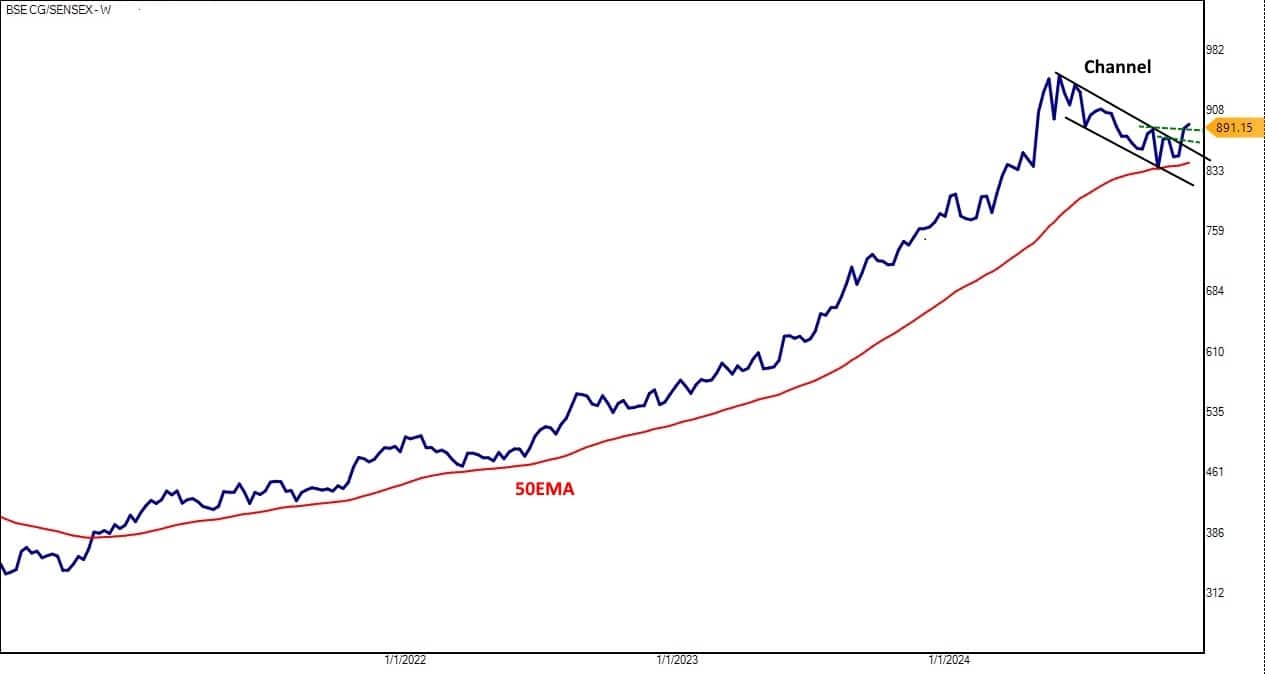
On the weekly ratio chart, the setup is potentially bullish given
>> The slope is heading northwards, signalling the resumption of Capital Goods’ outperformance over the Sensex.
>> The chart has broken out of a falling channel pattern, a significant technical strength indicator.
>> The breakout above the previous swing high reinforces the bullish outlook.
Interestingly, this breakout occurred above the 50-week exponential moving average (50WEMA), a level that has remained unbroken since 2021. This long-standing support underscores the sustained strength of the Capital Goods sector.
BSE Capital Goods Index Chart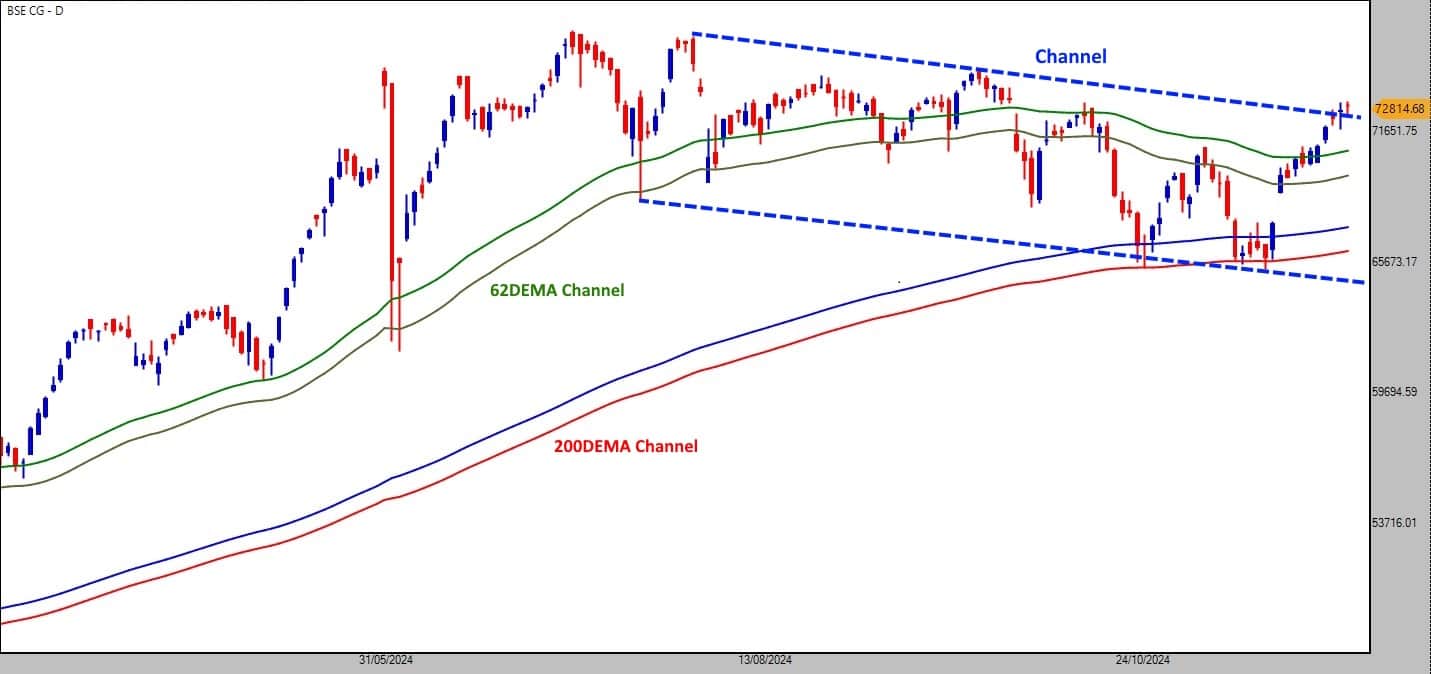
Turning to the daily chart of the BSE Capital Goods Index, the signals remain optimistic:
>> The index has broken out of a falling channel pattern, marking the resumption of a bullish trend.
>> It has reversed from the 200-day exponential moving average (200DEMA) channel and is now closing above the 62-day exponential moving average (62DEMA) channel.
>> Being above both short-term and medium-term averages solidifies the case for sustained bullish momentum.
This technical confluence suggests that the BSE Capital Goods Index is poised to extend its leadership in 2025.
Who Can Lead the Index?Identifying the potential leaders within the index is as crucial as recognising the broader trend. Using the Top-Down Approach Scanner, we compared the performance of individual stocks within the BSE Capital Goods Index against the sector and the broader BSE500 Index. The scanner assigns scores, with higher scores indicating stronger performance.
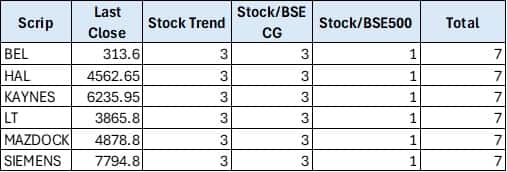
Six stocks stood out from this analysis, with a top score of 7. Larsen & Toubro (L&T) and Hindustan Aeronautics emerged as promising based on their individual charts and ratio charts.
Larsen & Toubro (L&T)L&T is a leading multinational in technology, engineering, construction, manufacturing, and financial services. With a diverse portfolio spanning infrastructure, defence, and power, L&T is a key player in India’s industrial growth.
L&T/BSECG Ratio Chart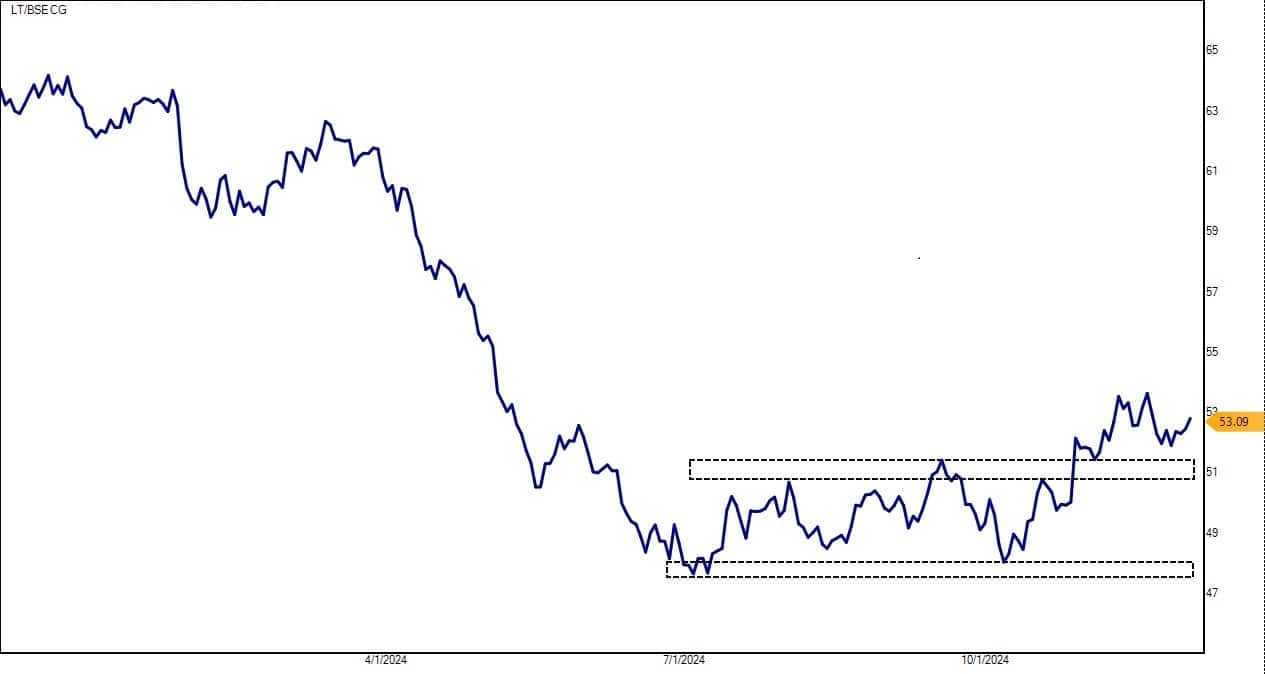
On the L&T/BSECG ratio chart, a strong base formation in 2024 has led to a breakout on the upside, indicating that L&T is set to outperform its sector peers.
Forming the base, the structure looks emerging for the LT in the Capital Goods space.
L&T Weekly Chart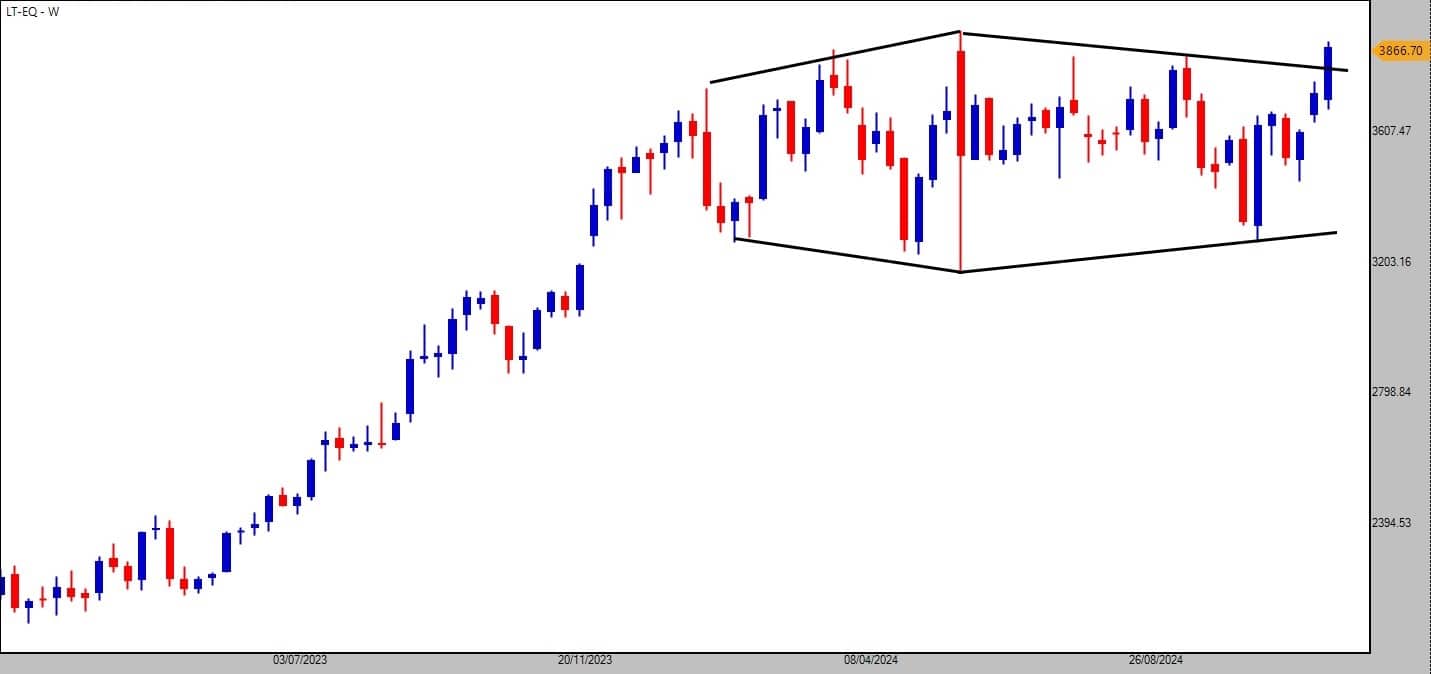
On the weekly price chart, L&T has broken out of a diamond pattern – a rare and powerful technical indicator signalling the end of consolidation and the start of a bullish trend.
A diamond pattern typically forms during a consolidation phase. It comprises converging trendlines that eventually break out in one direction, signalling a decisive move. In L&T's case, the breakout above this pattern strengthens the bullish outlook. With this breakout, L&T is entering uncharted territory, suggesting substantial upside potential.
Hindustan Aeronautics (HAL)Hindustan Aeronautics (HAL) is a premier aerospace and defence company. Known for manufacturing aircraft, helicopters, and related systems, HAL plays a pivotal role in India's defence sector and has significant export potential.
HAL/BSECG Ratio Chart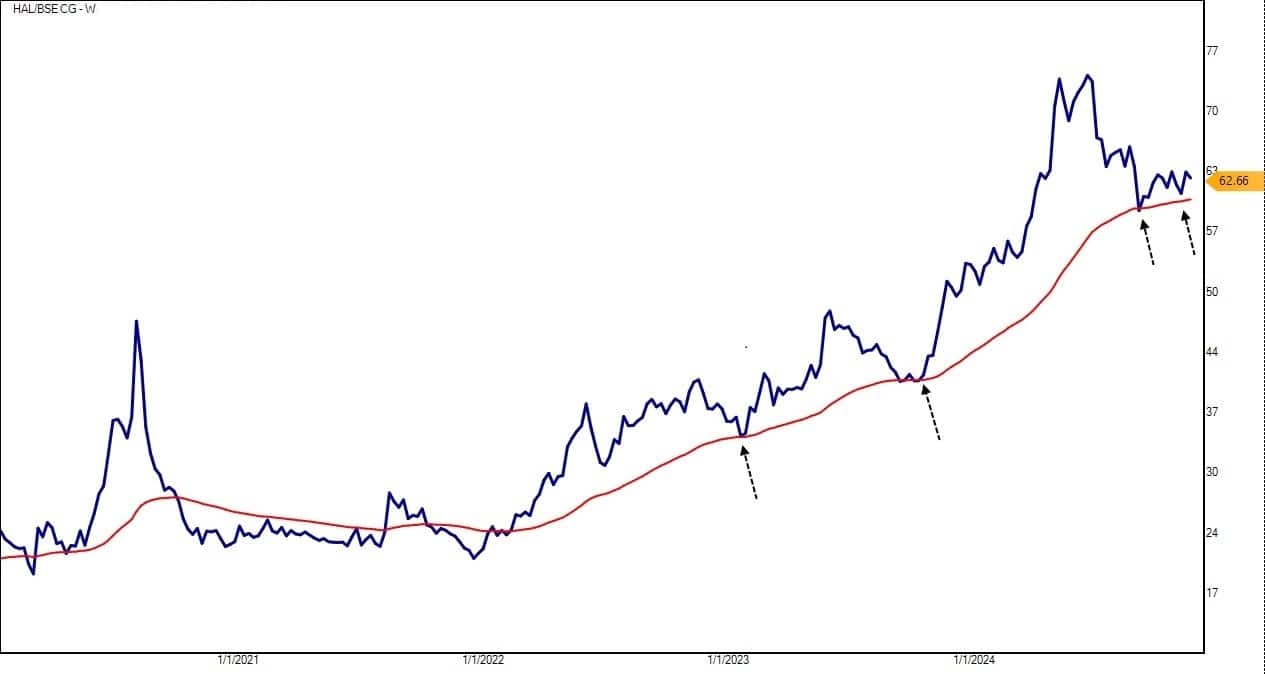
On the HAL/BSECG ratio chart, the slope from the 50WEMA on the weekly timeframe has turned positive. This moving average has historically served as a reliable support zone, and the upward slope signals potential outperformance.
HAL Daily Chart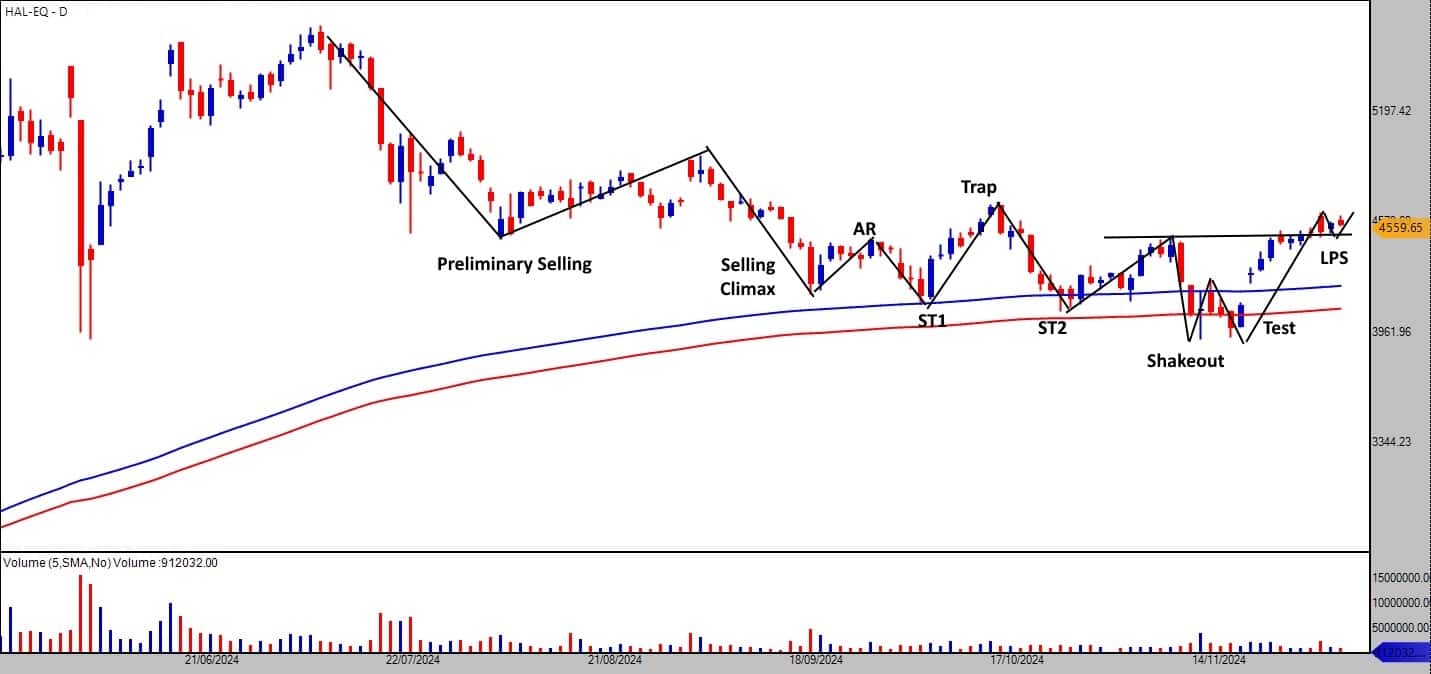
On the daily chart of HAL showcases a classic re-accumulation phase, per Wyckoff’s theory. The Wyckoff phase represents a period where strong hands consolidate their positions after a rally. In HAL’s case, the shakeout or spring phase below Rs 4,000 marked a temporary low, followed by a breakout above Rs 4,500, confirming a higher high – higher low structure, a hallmark of a bullish trend per Dow Theory.
With support from the 200DEMA moving average channel, HAL can lead the index higher.
A Promising Outlook for 2025The combination of technical breakouts in the BSE Capital Goods Index, its ratio chart against the Sensex, and the strength in individual leaders like L&T and HAL paints an optimistic picture for the sector in 2025. With its robust fundamentals and strong technical setups, the Capital Goods sector appears ready to continue its market leadership.
Note: The purpose of this article is only to share interesting charts, data points and thought-provoking opinions. It is NOT a recommendation. This article is strictly for educative purposes only.Disclaimer: The views and investment tips expressed by investment experts on Moneycontrol.com are their own and not those of the website or its management. Moneycontrol.com advises users to check with certified experts before taking any investment decisions.

Discover the latest Business News, Sensex, and Nifty updates. Obtain Personal Finance insights, tax queries, and expert opinions on Moneycontrol or download the Moneycontrol App to stay updated!
Find the best of Al News in one place, specially curated for you every weekend.
Stay on top of the latest tech trends and biggest startup news.


