


Indian markets have been experiencing challenging terrain, with the bears taking the lead recently. This shift has manifested in the form of bearish momentum, particularly visible on the Nifty50 weekly chart, where a bearish candlestick pattern has emerged. However, market lows do not necessarily signify an inevitable continuation of negative momentum. Instead, it suggests an underlying potential for positive movements as we delve into the broader market structure.
In the midst of market darkness, there is an opportunity for light to shine—a concept that ties into the ancient Yin and Yang theory.
Yin and Yang, a concept from Chinese philosophy, describe how seemingly opposing forces are interconnected and interdependent. The theory states that every negative (Yin) phase contains an element of positivity (Yang) and vice versa. In the current bearish phase of the market, there are potential stocks for a positive reversal.
Before jumping to the stocks showing bullish signs during this turbulent phase, let us analyse the Nifty50 chart.
Nifty50 Weekly Chart  On the Nifty50 weekly chart, the index is testing a critical demand zone created using the High and Low of 62-week Exponential Moving Average (62WEMA) Channel. Since 2016, the 62WEMA has served as an important support zone for the index, and the current levels are no different.
The Nifty50 is now approaching a demand zone between 22,750 and 23,300. If the index enters this support zone, there could be an opportunity for a reversal, with stocks in a bullish retracement phase offering significant potential.
But what exactly defines a bullish trend and retracement in the context of individual stocks?
Defining the Bullish Trend and Retracement
For a stock to be classified as part of a bullish trend, it must be above the 200-day EMA on both the weekly and daily charts. This confirms the stock is in an uptrend.
To identify a retracement, we look for stocks in a bullish trend where the Relative Strength Index (RSI) is below 40 on the daily chart. This indicates the stock has recently pulled back but still maintains the potential to resume upward movement once the retracement phase concludes.
Our screening process has identified 55 stocks that meet these criteria, and we have selected three that stand out based on Harmonic Patterns and have the potential to resume their bullish momentum.
Affle India is a global technology company that has been a key player in digital advertising. Despite market volatility, the stock has shown promising long-term growth prospects.

On the daily chart, Affle India is currently forming a Bullish Bat Harmonic Pattern. The probable reversal zone (PRZ) lies within the range of Rs 1,510-1,550.
Harmonic patterns are a form of technical analysis that aims to predict price reversals by identifying certain formations in the price chart. The Bullish Bat pattern specifically indicates a potential trend reversal after a price decline. When the price approaches the PRZ, readers should look for confirmation in the form of bullish candlestick formations. This confirmation provides a solid foundation for considering a trade that could see the stock resume its bullish trajectory.
EID Parry, a prominent player in the Indian agribusiness sector, has been consistently outperforming both its sector and the broader markets. This resilience has made it an attractive stock for long-term investors. However, like many stocks, EID Parry is experiencing a current retracement, which presents an opportunity for a potential reversal.
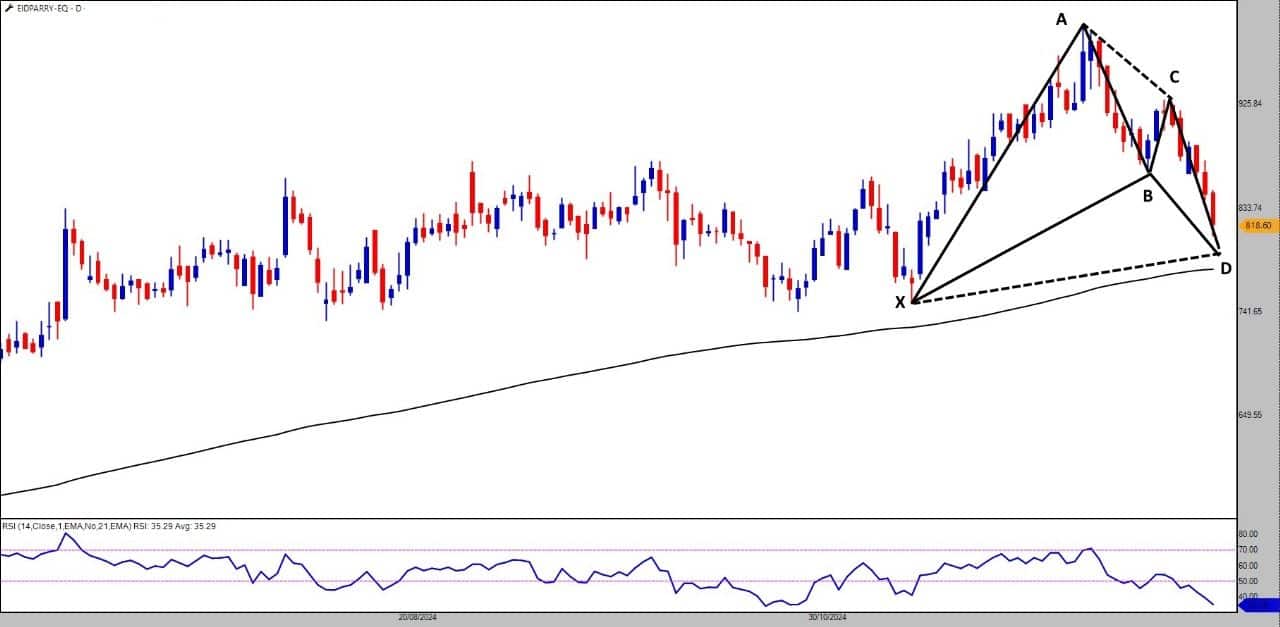
The Bullish Bat Pattern is clearly visible on the daily chart, with the PRZ located in the range of Rs 785-800. This offers a compelling potential entry point for traders looking for a reversal in a high-quality stock. Additionally, the 200 DEMA is positioned around these same levels, adding another layer of support. This confluence of technical factors enhances the likelihood of a successful reversal.
NALCO, a major player in the Indian metals and mining sector, has experienced significant price fluctuations, typical of cyclical industries. However, the stock is currently testing a critical support zone, offering traders an intriguing opportunity.
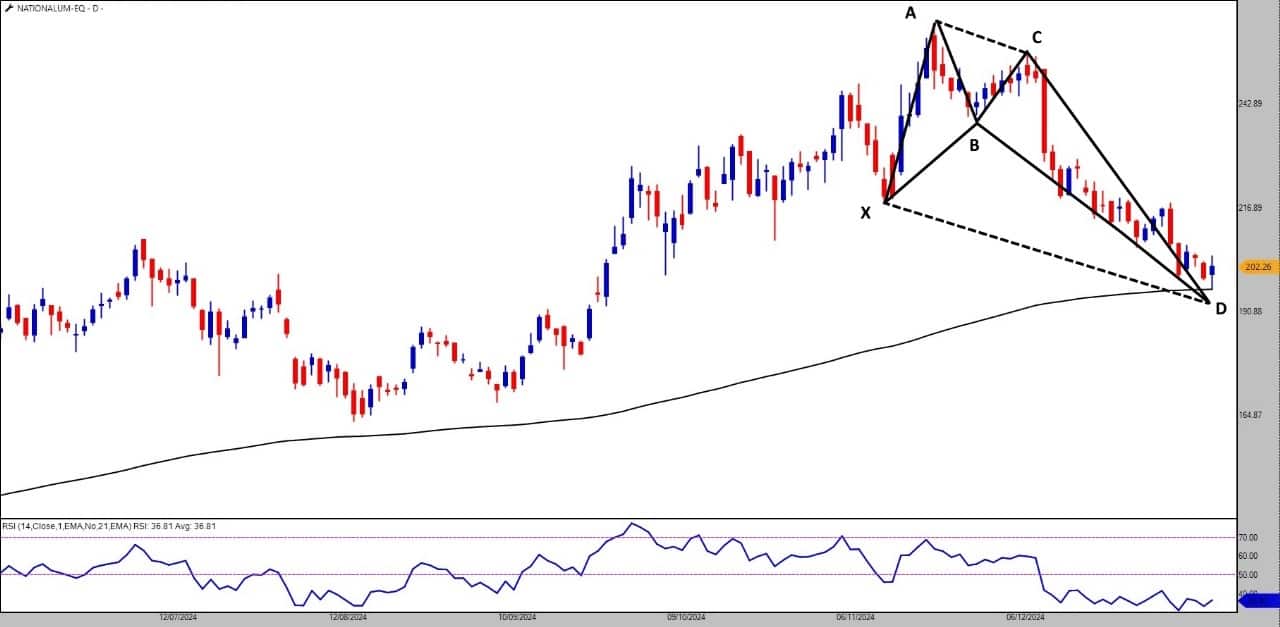
On the daily chart, the stock price recently tested the 200DEMA, signaling the potential for a reversal from this support zone. Additionally, the Bullish Crab Pattern, another harmonic formation, is visible on the chart, with the PRZ falling between Rs 192 and Rs 198. Although the stock briefly dipped to a low of Rs 196, it managed to close above Rs 200, further signalling the potential for a rebound.
Given the confluence of support levels from the 200DEMA and the Bullish Crab pattern, National Aluminium is poised for a potential bullish resurgence.
Bullish Opportunities in a Bearish Market: The Yin and Yang of Trading
These three stocks—Affle India, EID Parry, and National Aluminium—are emblematic of the Yin and Yang theory in action. While the market may currently be in a bearish phase (Yin), these stocks have the potential to flip the script, displaying bullish qualities that can shine through the darkness (Yang). The technical patterns and key support levels set the stage for possible trend reversals, signalling opportunities for traders and investors alike.
Note: The purpose of this article is only to share interesting charts, data points and thought-provoking opinions. It is NOT a recommendation. This article is strictly for educative purposes only.Disclaimer: The views and investment tips expressed by experts on Moneycontrol are their own and not those of the website or its management. Moneycontrol advises users to check with certified experts before taking any investment decisions.
Discover the latest Business News, Sensex, and Nifty updates. Obtain Personal Finance insights, tax queries, and expert opinions on Moneycontrol or download the Moneycontrol App to stay updated!
Find the best of Al News in one place, specially curated for you every weekend.
Stay on top of the latest tech trends and biggest startup news.


