


The market is anticipated to be volatile on budget day due to expected announcements from the Finance Minister across various sectors. Experts are closely watching the fiscal consolidation path and GDP growth estimates. With India's strong economic growth, all eyes are on the interim budget, especially ahead of general elections.
The market recently saw a recovery, facing resistance at 21,800-21,850, with 21,500 as a support area. Broader markets outperformed benchmarks, with the Nifty Midcap 100 index gaining 1.6 percent and Smallcap 100 index rising 2.25 percent, maintaining a volatility level around 16.
Moneycontrol has selected 13 budget sensitive stocks, which have given healthy returns in the past several quarters/months. These are Larsen & Toubro, KEC International, Siemens, NTPC, REC, Hindustan Aeronautics, Macrotech Developers, Aptus Value Housing Finance, Container Corporation of India, Amber Enterprises India, National Fertilisers, Rail Vikas Nigam, and IRCON International.
Here's what experts recommend investors should do with these stocks when the market resumes trading on Budget day:
Expert: Ashish Kyal, CMT, Founder / CEO at Waves Strategy Advisors
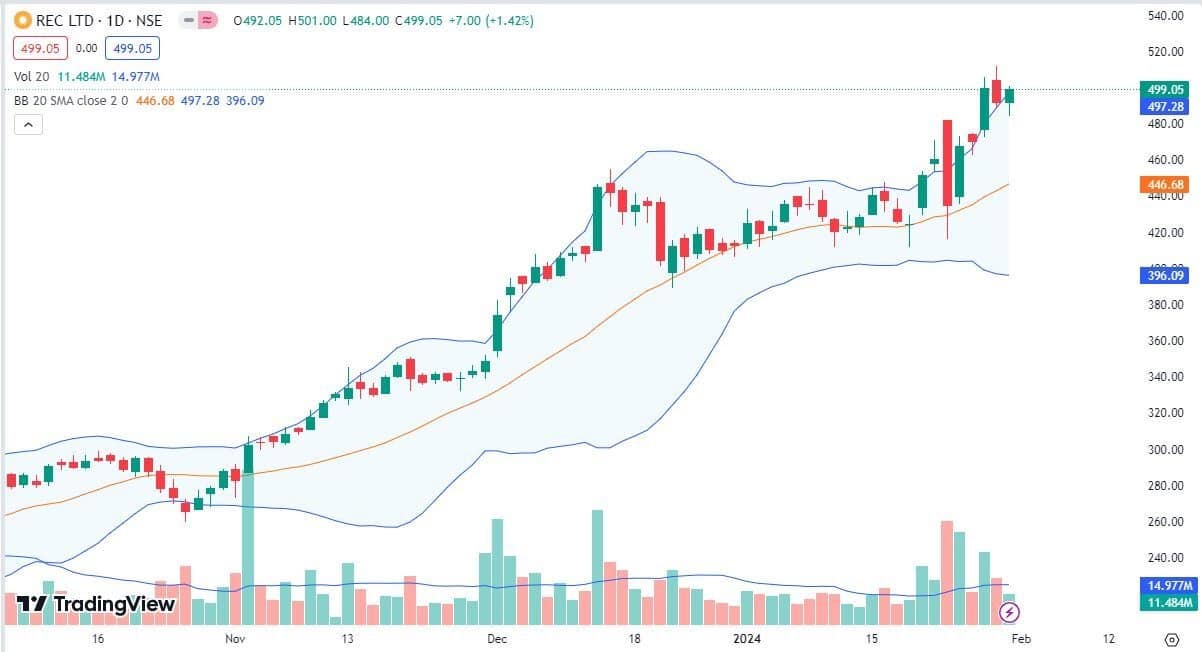
REC has formed a bullish candle on daily time frame and closed with a gain of 1.42 percent on January 31. Despite of negative opening stock rebounded from important support area and managed to close near day’s high which is indicating strength in this stock.
The stock has successfully defended Rs 482 level, which was the previous swing level. Rs 482 can now act as crucial support for the stock. Price continued its move higher with the upper band and since past 5 trading sessions has not given any close below its previous day’s low which keeps the tone positive.
In short, REC looks bullish. A breach above Rs 505 can lift price higher towards Rs 525 level as far as stock holds Rs 482 level on the downside.
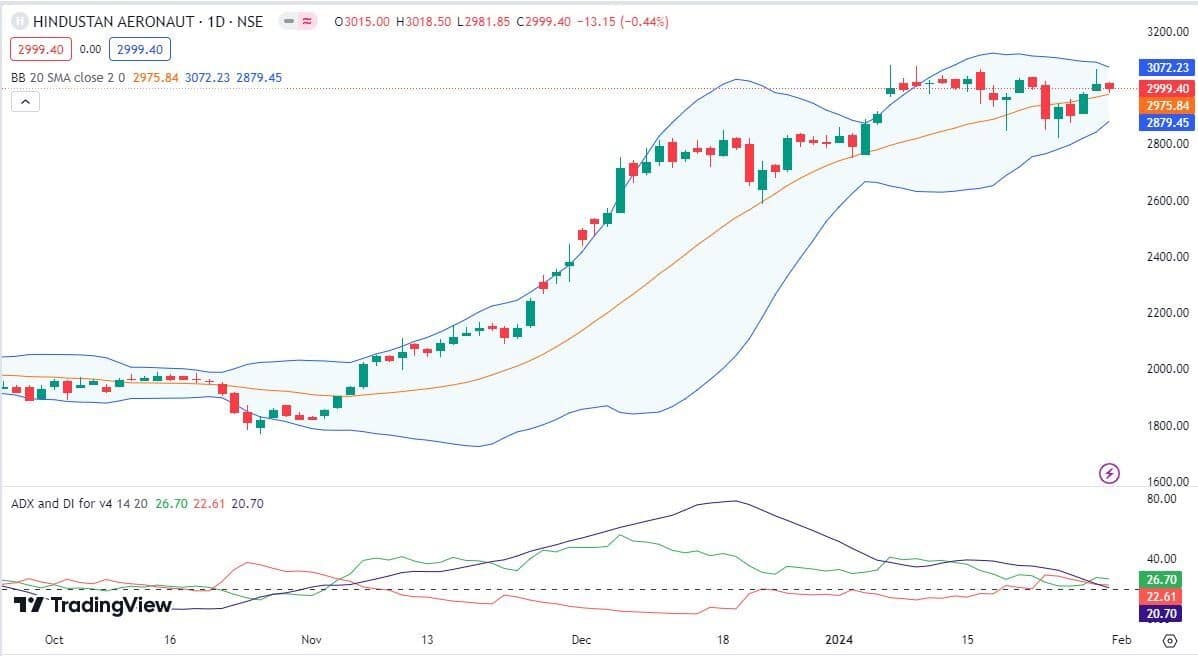
HAL is moving up in higher high higher low formation. However, currently prices are consolidating within a range of Rs 2,830-3,060. Bollinger bands have squeezed and a trending move is much awaited. A decisive break above Rs 3,060 is must for fresh buying to emerge.
A decisive break of the mentioned range can result into a trending move. ADX (average directional index) is also suggesting rangebound move as it is showing reading of 20. The low readings of ADX indicates that the stock is in a range. If ADX trades above 25 then it can result into a trending move.
In short, HAL is likely to trade in a broader range of Rs 2,830-3,060. A break above Rs 3,060 can lift the price higher towards Rs 3,200 with support near Rs 2,830 level.
NTPC is trading near record high levels. Price is forming higher highs and higher lows which keeps the tone positive for the stock. However, price is facing resistance near Rs 320 levels. A breach above this level will resume further upside move to Rs 330.
Immediate support on downside is near Rs 310 level. As long as prices stay above 35-day exponential moving average trend remains bullish.
In short, NTPC is bullish. Move above Rs 320 will resume positive trend to Rs 335 levels with support at Rs 310 levels.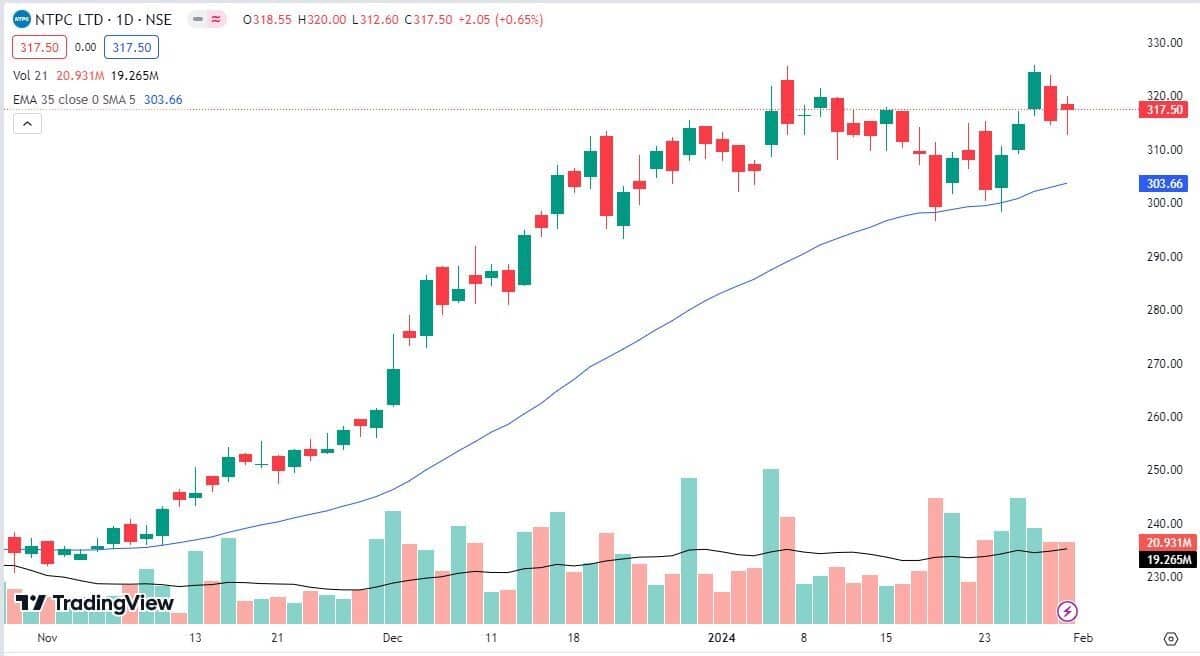
Expert: Rajesh Palviya, senior vice president research (head technical derivatives) at Axis Securities
The stock is in strong uptrend across all the time frames and sustaining above its 50, 100 and 200-day SMA (simple moving average) which reconfirms bullish sentiments. Since the past couple of months, the stock was experiencing Relative Strength Indicator - negative divergence which resulted in short term profit booking.
In addition, the monthly price action has resulted in a "Doji" candlestick pattern representing a short term pause in its bullish trend. As the primary still intact bullish, investors are advised to utilise such small corrections towards the support zone as a buying opportunity.
The "bullish gap" formed on December 4, 2023 within Rs 3,250-3,197 levels will act as a crucial support zone. On the upside, the stock may extend its rally towards Rs 4,100-4,280 levels in upcoming months.
We recommend investors to hold long positions with a crucial support zone of Rs 3,330-3,250 levels.

On the daily chart, the stock has confirmed a "symmetrical triangle" breakout at Rs 640 levels on a closing basis, indicating bullish trend reversal. Current week's buying force was observed from the 20, 50, 100 and 200-day SMA support zone which reconfirms bullish sentiments.
On the weekly and monthly time frames, the stock is trending higher forming a series of higher tops and bottoms indicating strong uptrend. This buying was accompanied with huge volumes which signals increased participation.
We recommend investors to continue with long positions with expected upside of Rs 770-813 levels in upcoming months. The short and medium term support is placed around Rs 625-595 levels.

The stock has a strong uptrend across all the time frames. On the weekly time frame, the stock has confirmed "V" shape breakout at Rs 4,020 levels indicating continuation of prior uptrend. On the monthly and quarterly charts, the stock is trending higher forming a series of higher tops and bottoms indicating bullish sentiments.
The stock is inching up along with rising 20, 50, 100 and 200-day crucial averages which supports positive bias. We recommend investors to continue with long positions with expected upside of Rs 4,500-4,885 levels in upcoming months.
The short and medium term support is placed around Rs 4,000-3,950 levels.
Expert: Vidnyan Sawant, HOD - research at GEPL Capital
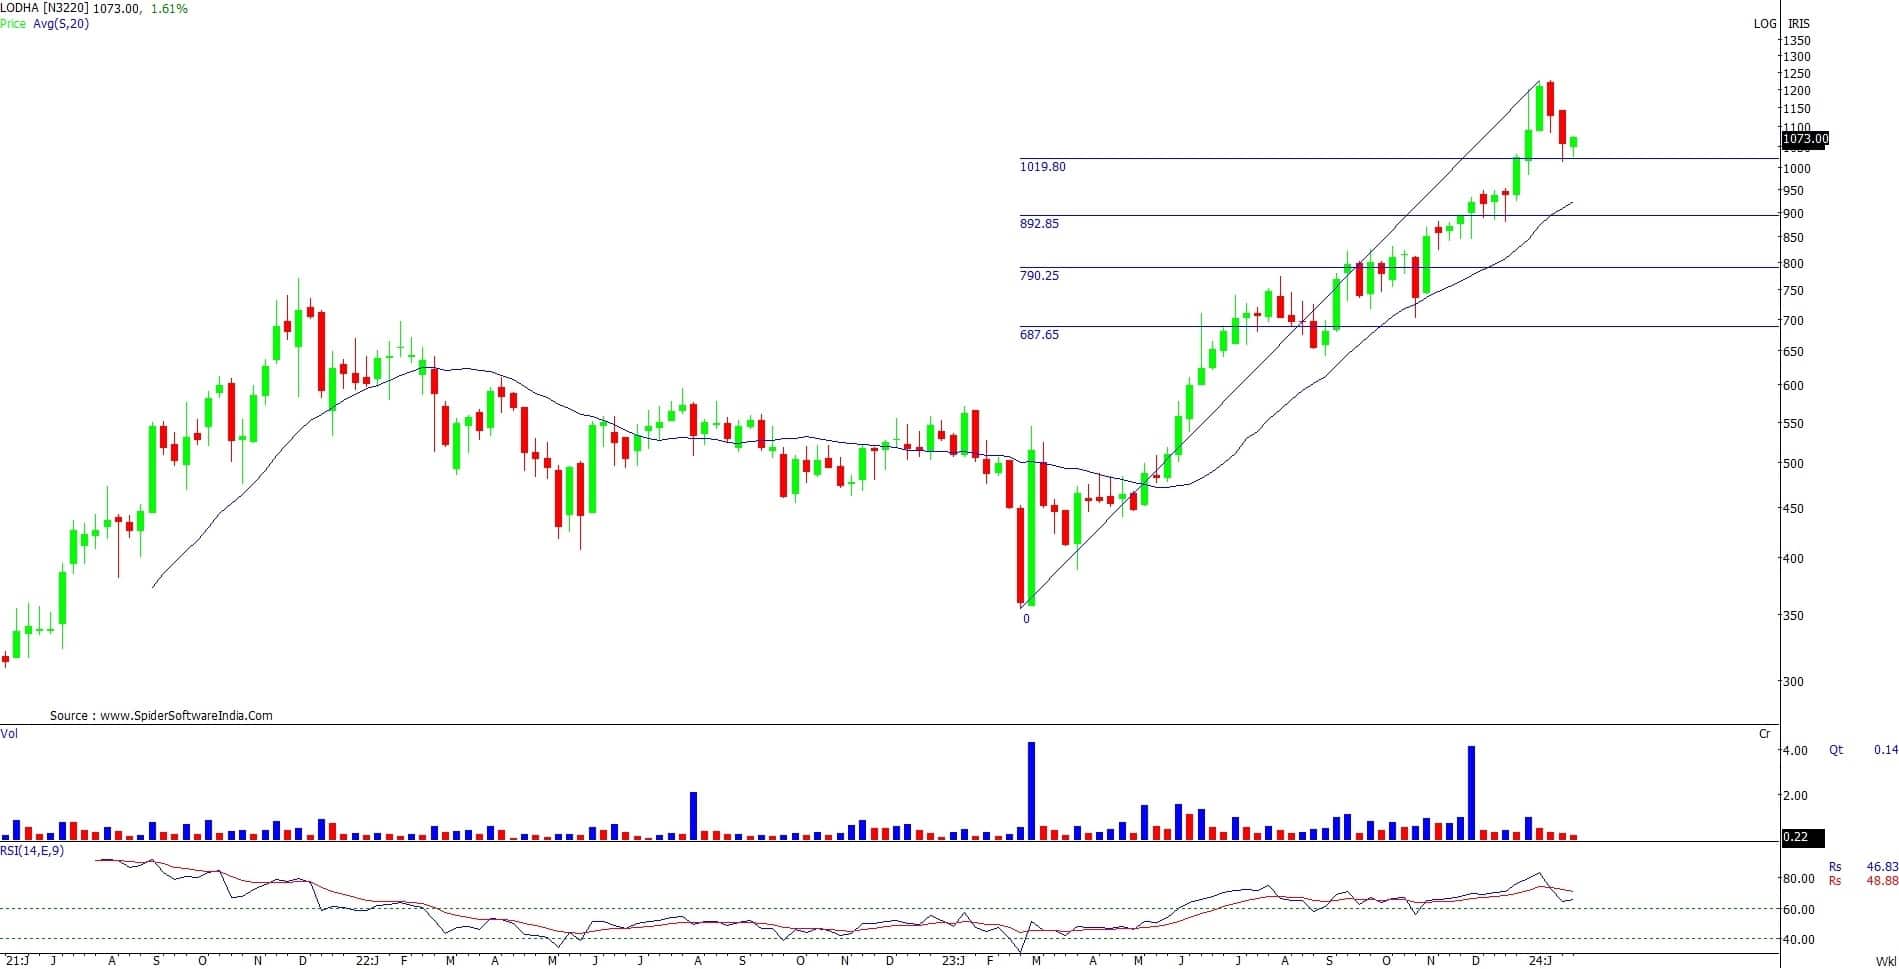
Macrotech Developers is currently exhibiting a higher top higher bottom formation on monthly charts, indicating a robust momentum for the medium to long term. The stock achieved a life high at Rs 1,225 and subsequently retraced to the 23.6 percent Fibonacci retracement level, where it bounced back, showcasing a strong positive sentiment.
Furthermore, the stock is maintaining a solid structure by respecting previous swing lows on the daily charts. This underscores the stock's overall strength. Notably, there has been a consistent increase in volume during each upward movement, highlighting positive market participation.
The relative strength index (RSI) on both weekly and monthly charts remains above the 60 level, indicating the establishment of a strong uptrend momentum.
Looking ahead, there is an anticipation of a continued price ascent towards Rs 1,225-1,300 mark. To manage risk, it is advisable to set a stop-loss at Rs 980, strictly based on the closing basis.
Aptus Value Housing Finance India
Aptus is currently trading at its 52-week high, displaying a higher top higher bottom formation that signifies strong momentum in the market. Since its low in March 2023, the stock has consistently followed an upward trend. Recently, there has been a breakout of a Double Bottom pattern with increased volume, indicating a continuation of the upward trend.
On the daily charts, the stock is exhibiting a steady upward movement with the formation of Change in Polarity (CIP), showcasing the positive strength of the stock.
The RSI indicator has played a crucial role in supporting this bullish scenario, consistently staying above the 60 level on all time frames. This reinforces the stock's robust momentum and contributes to a positive overall outlook.
Looking forward, there is an anticipation of further upward movement in prices, with a target set at Rs 445-500 levels. It is recommended to set a stop-loss at Rs 350 based on closing values.
Expert: Om Mehra, technical analyst at SAMCO Securities
Container Corporation of India
Container Corporation of India (CONCOR) has recently consolidated within a range, forming a double bottom pattern in the daily chart. The accompanying rising price is notable, coupled with a remarkable surge in trading volume, exceeding three times the 50-day average volume.
Bolstering the bullish sentiment, the stock exhibited a substantial bullish candle on the breakout day, affirming the strength of this upward movement.
Currently trading near all-time high levels, the stock is supported by a convergence of positive signals from multiple technical indicators.
All moving averages and momentum indicators have aligned, indicating a robust bullish momentum in the stock, emphasizing a potentially favourable outlook. Both the daily and weekly Relative Strength Index (RSI) are firmly situated in a higher zone indicating stock may zoom higher.
Tune into our live budget updates.
Hence, based on the above technical structure, one can initiate a long position at CMP Rs 887.50 for a target price of Rs 980. The stop-loss can be kept at Rs 825.

Amber Enterprises India is currently trading at Rs 4,437, maintaining a robust upward trend within a positive rising channel. The short-term moving averages of 20 and 50 days affirm this bullish momentum, indicating favourable momentum.
Despite a significant 40 percent surge in the past month, it might continue its primary trend. Delivery volume increasing by 28.43 percent over the last month, aligns with the rising price showcasing strong market support.
Hence, based on the above technical structure, one can initiate a long position at CMP Rs 4,437 for a target price of Rs 4,800. The stop-loss can be kept at Rs 4,250.

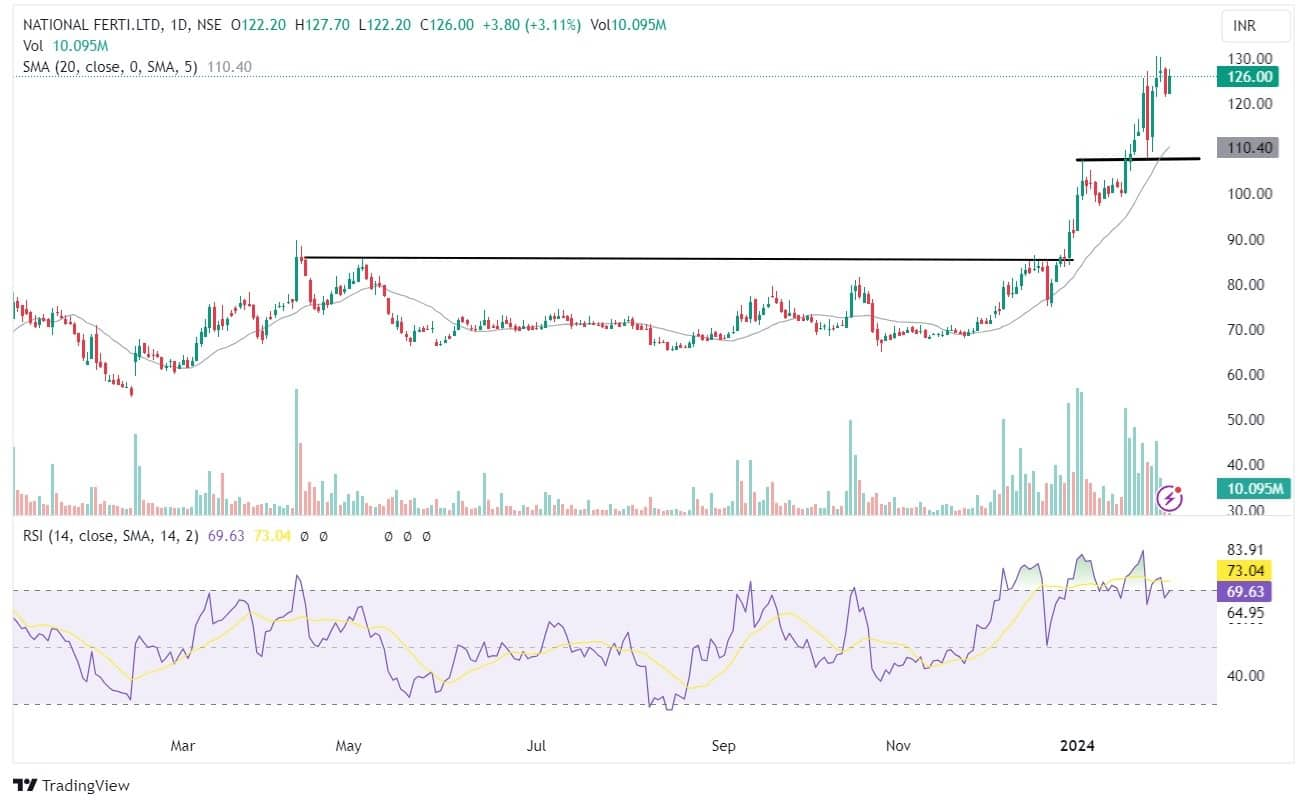
National Fertilizers (NFL) stock currently came out of the Cup with a Handle pattern formation and is continuing its ongoing bullish trend. On its daily chart, the stock's strength is evident as it consistently trades above the 20-day moving average. Furthermore, a positive MACD (moving average convergence divergence) crossover and an RSI at 69 signals favourable momentum.
Notably, the stock is ongoing higher highs and higher lows indicating increased buying interest, particularly among short-term traders.
Hence, based on the above technical structure, one can initiate a long position at CMP Rs 126 for the target price of Rs 142. Stop-loss can be kept at Rs 114.
Expert: Riyank Arora, technical analyst at Mehta Equities
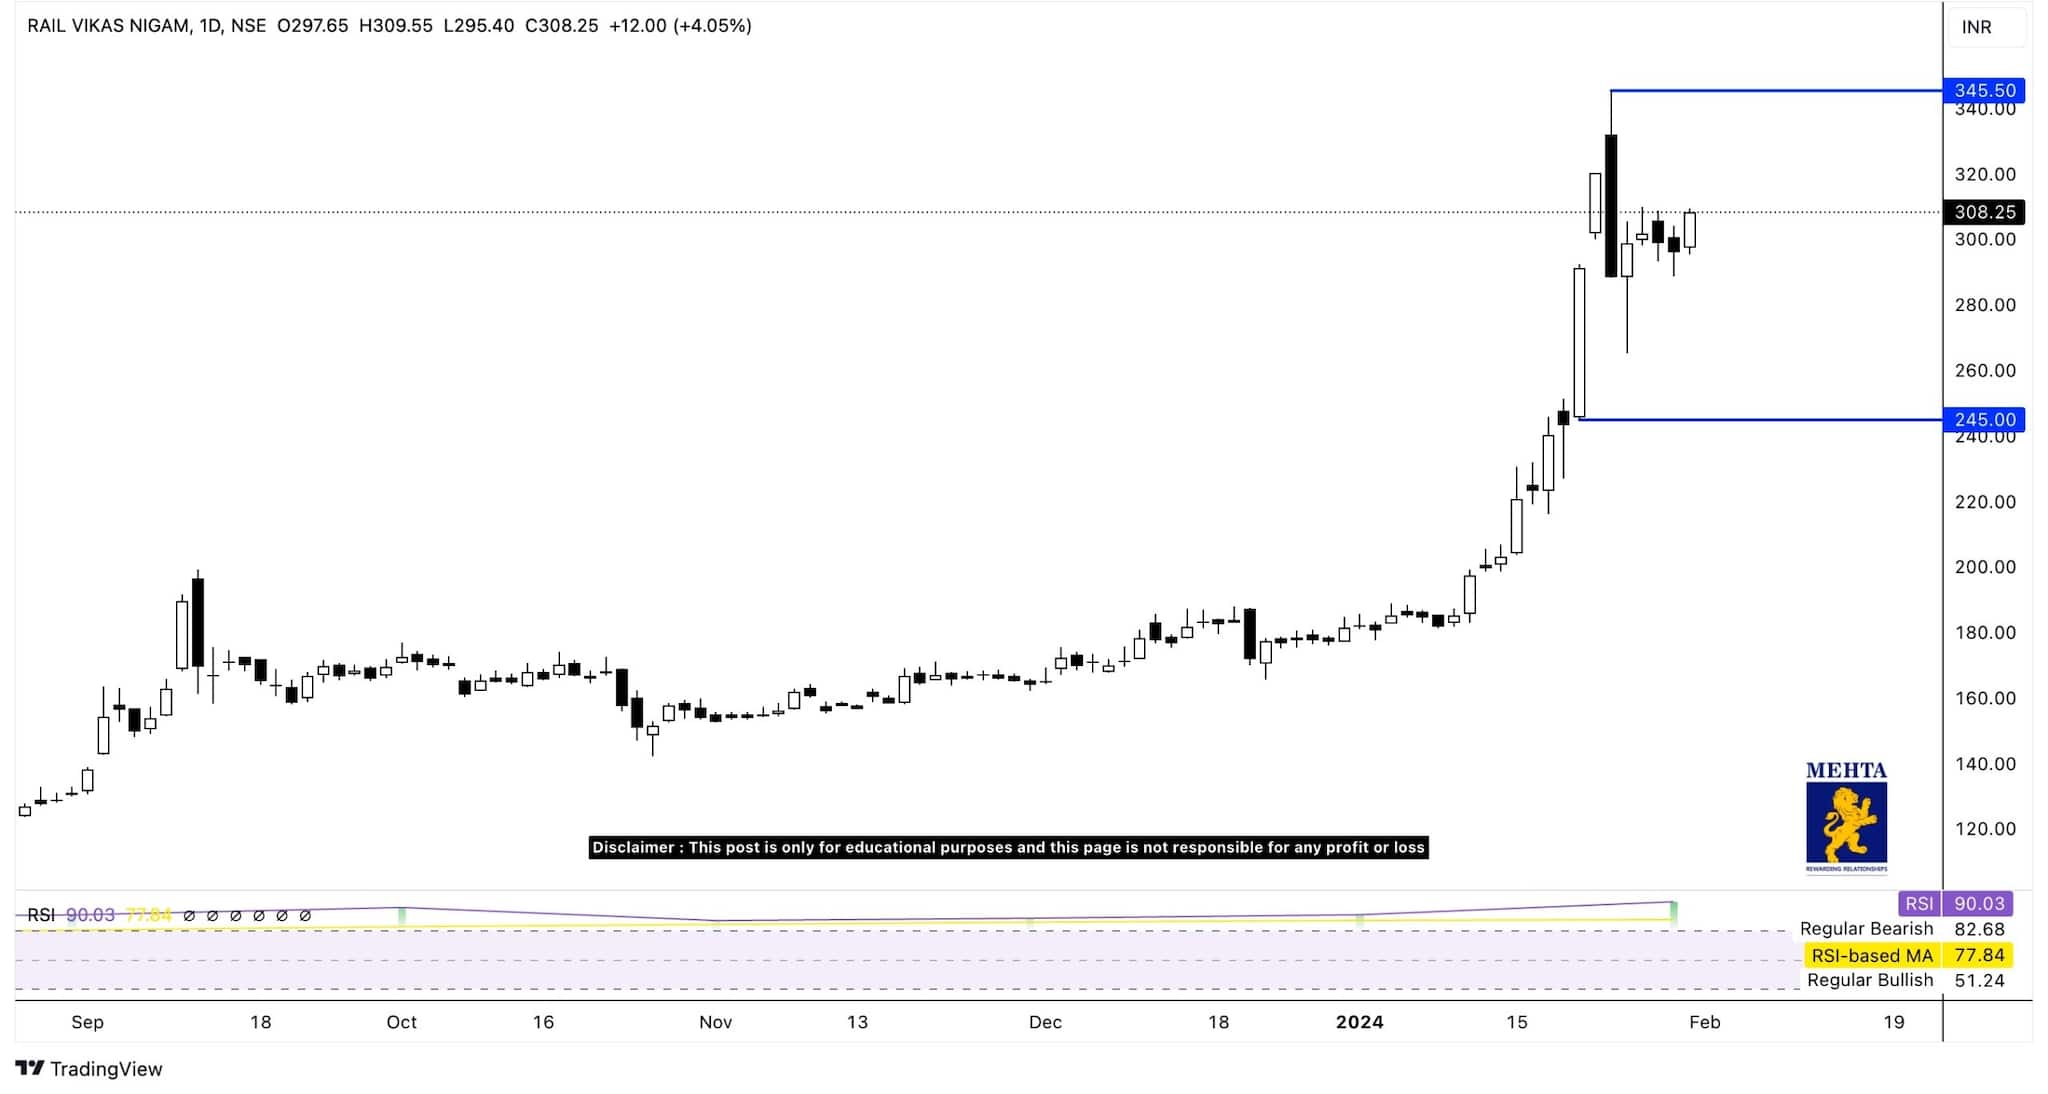
After rising nearly 70 percent in the last month, the monthly RSI for Rail Vikas Nigam (RVNL) is now at 90.03, indicating overbought conditions for the stock. The immediate support for the stock is at Rs 265, below which the stock can further drift down towards Rs 245 mark.
Despite the overall trend being positive, the upside looks limited from current levels. Investors are suggested to book profits on every rise.
After rising nearly 40 percent in the last month, the monthly RSI for IRCON is now at 92.18, indicating overbought conditions for the stock. The immediate support for the stock is at Rs 215, below which the stock can further drift down towards Rs 205 mark.
The overall trend is yet again positive for the stock, but many technical indicators and oscillators are indicating overbought conditions. Investors are advised to book profits on any rise as the upside seems limited from here.

Disclaimer: The views and investment tips expressed by investment experts on Moneycontrol.com are their own and not those of the website or its management. Moneycontrol.com advises users to check with certified experts before taking any investment decisions.
Discover the latest Business News, Sensex, and Nifty updates. Obtain Personal Finance insights, tax queries, and expert opinions on Moneycontrol or download the Moneycontrol App to stay updated!
Find the best of Al News in one place, specially curated for you every weekend.
Stay on top of the latest tech trends and biggest startup news.


