


The Moving Average Convergence Divergence (MACD) is one of the most popular technical indicators used in global markets. Its simplicity makes it accessible, and its structure gives traders a systematic way to identify momentum shifts.
But does it work in Indian equity markets over the long run?
To find out, Share.Market conducted a comprehensive 25-year backtest (Jan 2000 – May 2025) of MACD trading strategies across five major Indian indices. The results may surprise you.
Understanding MACD: The Basics
The MACD indicator compares two exponential moving averages — usually the 12-day and 26-day EMAs. The MACD line is the difference between these two.
Then comes the 9-day EMA of the MACD line itself — called the Signal line. Traders look for two primary signals:
● Signal Line Cross: When MACD crosses above the signal line, it's considered bullish; a cross below suggests bearishness.
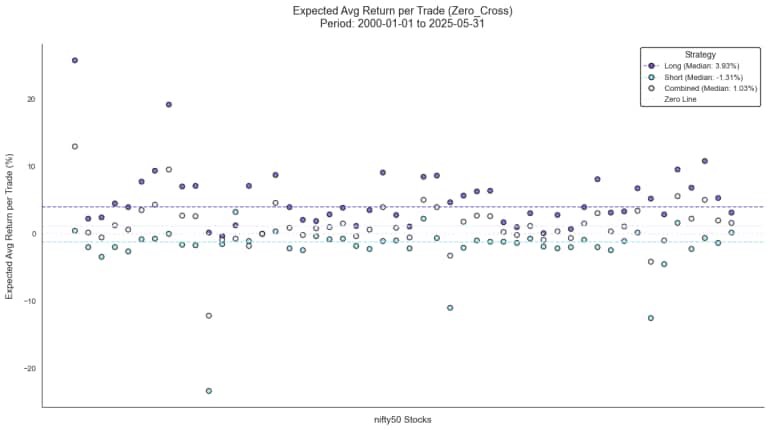
● Zero Line Cross: A move above zero indicates upward momentum; below zero suggests downward momentum.
These signals help traders time their entries and exits in momentum-based systems.
 .
.
Backtest Methodology
We tested three rule-based trading strategies for each signal type:
1. Long-only: Buy on bullish signals; exit on bearish ones.
2. Short-only: Short on bearish signals; cover on bullish ones.
3. Combined: Alternate between long and short trades.
Each trade’s performance was measured by:
● Expected Return per Trade:
= (Avg Win% × Win Rate + Avg Loss% × Loss Rate) / Total Trades
● Expected Return per Day:
= Expected Return per Trade ÷ Average holding period
All price data was adjusted for splits, dividends, and bonuses.
Insights from the research undertaken:
1. Long-only MACD Strategies works in the long-term:
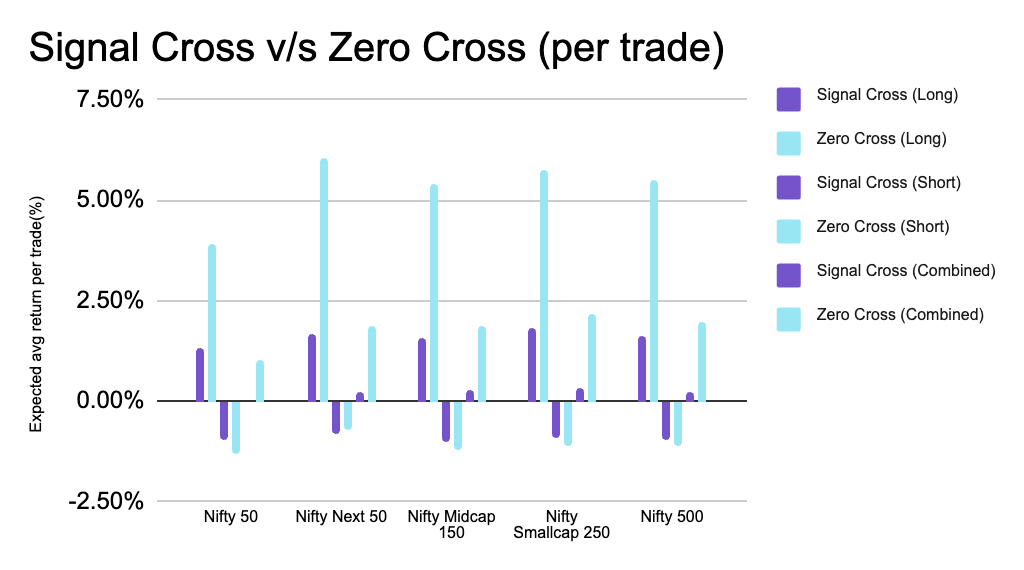
Observation: Across every index, long-only trades were profitable, especially when triggered by Zero Line Crosses. For instance:
● Nifty 50 Long on Zero Cross: Avg return/trade = 3.93%
● Nifty Smallcap 250 Long on Zero Cross: Avg return/trade = 5.74%
● Nifty Next 50 Long on Zero Cross: Avg return/trade = 6.02%
These numbers indicate that MACD performs better on broader, more volatile indices compared to the large-cap-heavy Nifty 50.

 .
.
2. Short-only and combined trades underperformed
Observation: Shorting based on MACD signals failed to deliver consistent returns. Losses were common, with performance salvaged only during crashes (e.g. 2008, 2020).
Even the combined long-short strategy underwhelmed, proving that switching sides frequently may not offer an edge.
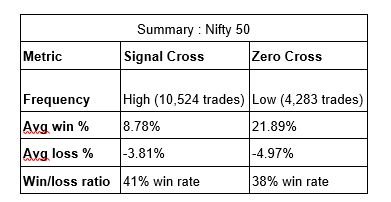
3. Signal Line vs Zero Line: Both worked
Let’s look at Nifty 50:
 .
.
While Signal Line Crosses happened more frequently, Zero Crosses delivered much higher returns per trade. This makes them better suited for long-term trend-following strategies.
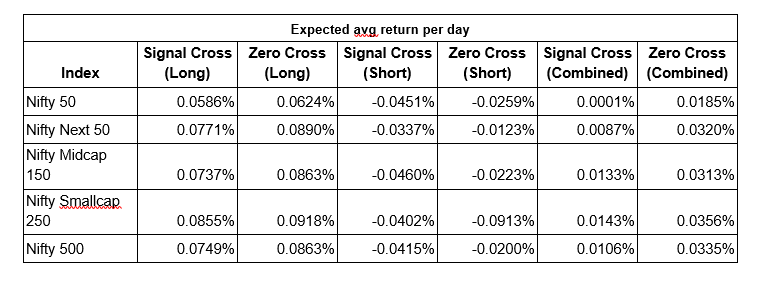
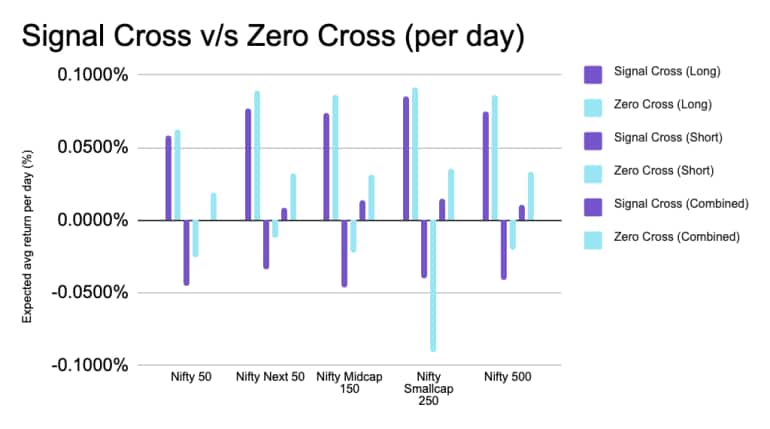
4. Daily returns further support long-only strategies
Observation: Long-only Zero Crosses produced the best daily returns across all indices.
Short-only trades led to negative returns per day across the board.
 .
.
 .
.
5. Broader indices like Smallcap 250 performed better then Nifty 50
Observation: The wider and more volatile the index, the better the MACD strategy worked. That’s likely because midcaps and smallcaps tend to trend more strongly and react faster to momentum signals.
● Nifty Smallcap 250 Long on Zero Cross: 5.74% avg return
● Nifty 50 Long on Zero Cross: 3.93% avg return
 .
.
 .
.
Real-World Limitations
This study is directional — not a plug-and-play trading system. Key limitations include:
● End-of-Day Execution: All signals are based on daily close prices, not real-time data. So slippage, bid-ask spread, brokerage and intraday volatility aren’t captured.
● Static Index Constituents: We used the current composition of indices throughout the backtest. In reality, index members change over time. This standardization ensures uniformity but isn't perfectly reflective of real historical conditions.
Why This Matters to Indian Retail Traders
Retail investors in India often trade on emotion, TV tips, or random signals. This research shows that structured, rule-based strategies like MACD can outperform discretionary trading — especially over longer periods.
And the best part? You don’t need expensive software or coding skills. MACD is built into most of the broking platforms such as Share.Market app and website.
So, Does MACD Work in India?
Yes — with caveats.
If you use a disciplined, long-only strategy, MACD has historically worked in Indian markets — particularly on broader and more volatile indices.
It's not magic. It's not foolproof. But it's far better than guesswork.
For retail investors or aspiring system traders, MACD can be a powerful entry point into momentum-based strategies — especially if you’re in it for the long game.
Disclaimer: No Moneycontrol journalist was involved in this article
Discover the latest Business News, Sensex, and Nifty updates. Obtain Personal Finance insights, tax queries, and expert opinions on Moneycontrol or download the Moneycontrol App to stay updated!
Find the best of Al News in one place, specially curated for you every weekend.
Stay on top of the latest tech trends and biggest startup news.


