


Recently released Household Consumption Expenditure Survey (HCES) data for 2022-23 has led to a series of poverty estimates, and commentary surrounding the extent of poverty decline in India over the last decade. Heightened interest in the findings of the survey is understandable given the long gap of 11 years between the latest and the previous such survey in 2011-12.
There are two key results from HCES 22-23. First, that extreme poverty (defined as poverty according to the World Bank’s 2011 PPP$ 1.9 poverty line of per capita per month consumption of Rs. 1454 in rural areas and Rs. 1750 in urban area) has now been eliminated; it is less than 2 percent, compared to 12.5 percent in 2011-12. Second, that consumption inequality in India has declined from its 2011-12 level – a finding consistent from most, if not all, household surveys, private or public, conducted over the last decade. This is in major contrast to the discussion on increasing consumption (and income) inequality in India.
Some have recently pointed out changes in survey methodology, arguing that the two surveys are “non-comparable”. This is an important issue that merits a discussion, particularly on what evidence is there to argue that the two surveys are “non-comparable”. There are changes across every survey – particularly because consumption items itself undergo changes.
The National Statistical Office (NSO) seemed to have been well aware of murmurs regarding “incomparability”. All surveys contain differences from previous surveys – computer tabulation versus worksheet, elimination of some items (telephones? vs. mobiles, etc). This does not render the survey as “incomparable”. There is NO reference in the Fact Sheet that 2022-23 survey is not comparable to 2011-12; instead, there is this statement:
The changes “are required to be noted while comparing the results of HCES:2022-23 with those of the previous surveys.” (Page 4 of the Fact Sheet On HCES: 2022-23, MOSPI, GoI).
India’s Poverty Line
Before further discussion, it is important to understand how poverty calculations are undertaken. There are two important inputs into an estimate of poverty. The first is a poverty line i.e. the level of consumption below which a person is deemed poor. The second important and necessary input is data on (fractile) consumption expenditures of the population. The consumption expenditures give us a consumption distribution (see statement 4 of the Fact Sheet on HCES: 2022-23).
Some contend that India does not have an official poverty line. This is an error. In 2009, and prior to the release of the 2009/10 HCES survey, the government pre-announced the poverty line for different states (and regions) of the country. This came to be known as the Tendulkar poverty line.
The worldwide official home of poverty estimates is the World Bank, and soon after the release of the GOI Tendulkar poverty line, the World Bank offered the PPP $ 1.9 poverty line. There is a less than 3 percent difference between PPP$ 1.9 and Tendulkar lines, and hence the World Bank line has attained universal acceptance.
The PPP$ 1.9 line in 2011-12 was Rs 790 per person per month in rural areas and Rs 967 in urban India. For 2022-23, on the basis of inflation factors provided in the Fact Sheet, the poverty line in rural areas is Rs 1,452 and for urban areas it is Rs 1,752. That is, anyone who earns less than these amounts in a month for rural and urban areas respectively is classified as poor as per the World Bank PPP$ 1.9 line.
Consumption Expenditure And Poverty Line
Statement 4 of the Factsheet gives us a consumption distribution (reproduced below) – the second important piece of information needed to arrive at poverty estimates. It can be easily seen that the average monthly per-capita consumption expenditures from the survey are greater than the poverty line for households that belong to the fractile class greater than 5. That is, only for the bottom 5 percent of the population in the rural areas is the average monthly per-capita consumption expenditure lower than the poverty line.
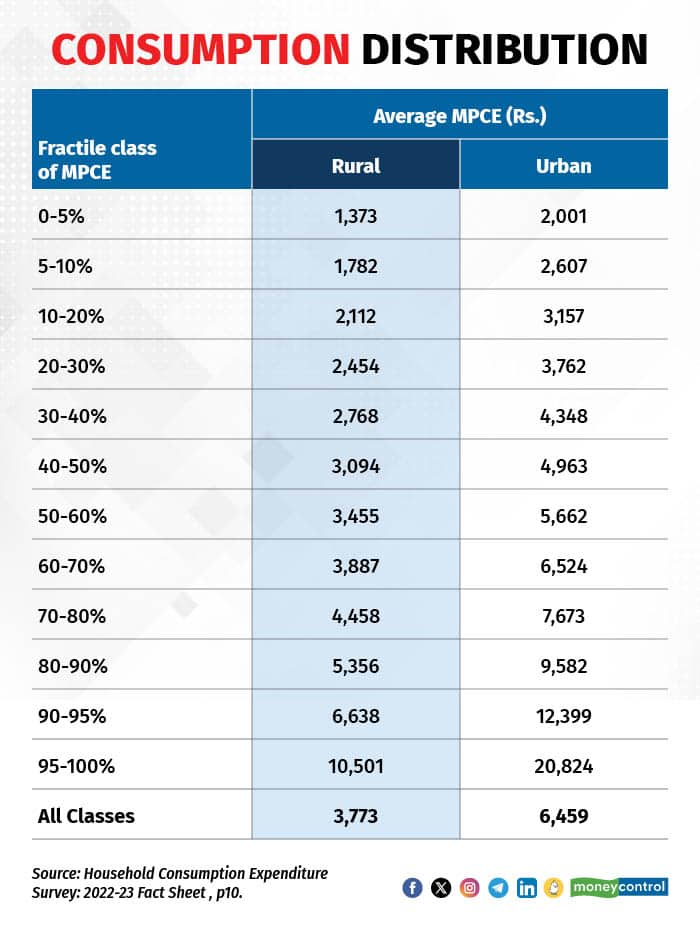
This establishes that using the Tendulkar poverty line, the poverty rate in India has to be less than 5 percent, and any poverty estimate greater than this is incorrect either due to use of different “unofficial” poverty lines, or due to some other methodological or computational errors. NITI Aayog’s CEO mentioned that poverty in India is less than 5 percent, and that is indeed true as can be seen simply from the consumption distribution and poverty lines.
We can go further and provide a near precise estimate of poverty in India. Given that we have the average MPCE of the bottom 5 percent of the population, we can statistically interpolate the mean monthly per-capita consumption expenditures for every percentile. By definition, the average MPCE for 0-5 percent would mean that at least some households would have an MPCE greater than the average while others would have it lower. Estimating the mean consumption at the percentile level allows us to approximately identify the population below the poverty line. This is done separately for rural and urban households.
Based on this exercise, we find that rural poverty stands at 2.5 percent and urban poverty is down to 1 percent, with all India headcount ratio (HCR) at 2 percent. That is, only 2 percent of Indian households have a consumption expenditure lower than the Tendulkar poverty line. Note, that the only information we need for estimating poverty in 2022-23 is the latest consumption distribution, and an inflation update of the poverty lines. Both these sets of data are in the Fact Sheet. And note also that we do this without any reference from previous surveys.
The reader (or critic) can object to the choice of the official poverty line, however, what is not credible or acceptable (as some have argued) that given CES data, and given the Tendulkar poverty line, that the poverty level in India is more than 2 percent.
Surjit S Bhalla is Former Executive Director for India, Bangladesh, Sri Lanka and Bhutan - International Monetary Fund. Karan Bhasin is a New York based economist. He tweets @karanbhasin95. Views are personal, and do not represent the stand of this publication.
Discover the latest Business News, Sensex, and Nifty updates. Obtain Personal Finance insights, tax queries, and expert opinions on Moneycontrol or download the Moneycontrol App to stay updated!
Find the best of Al News in one place, specially curated for you every weekend.
Stay on top of the latest tech trends and biggest startup news.


