


Unified Payments Interface, or UPI, the instant real-time payments system developed by the National Payments Corporation of India (NPCI), continues to dominate the Indian payments system, shows the ‘India Digital Payments Report’ (H2 2023) from Worldline India, a licenced payments aggregator.
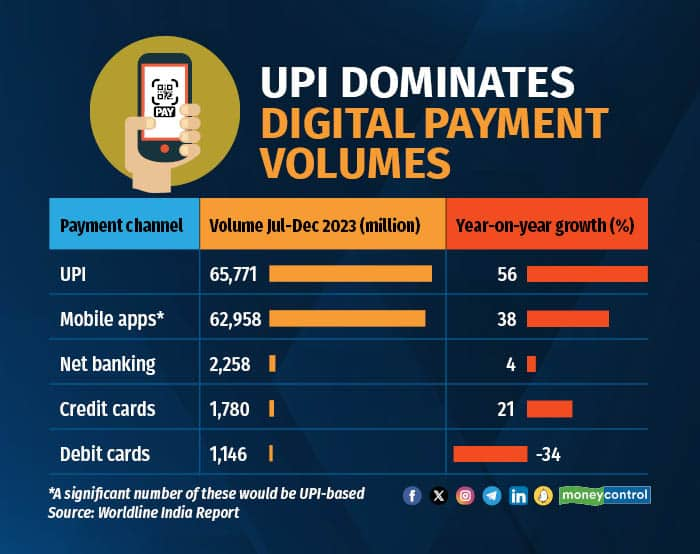
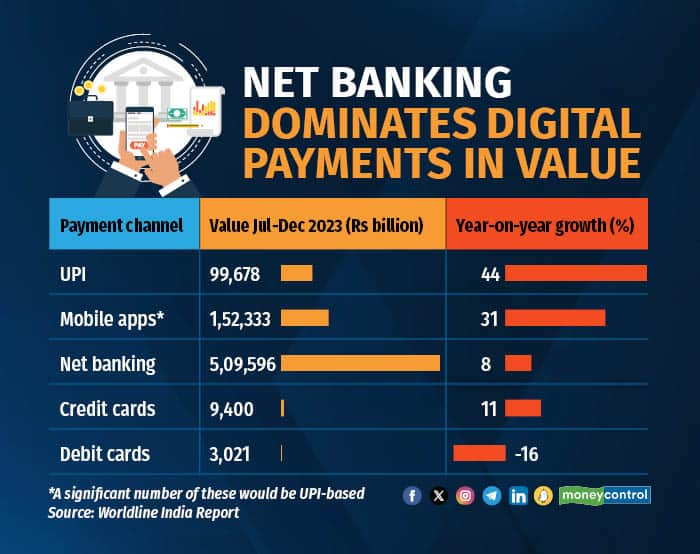
There were 65,771 million UPI transactions totalling Rs 99,678 billion in value during July–December 2023 (H2 2023) implying a growth of 56 percent and 44 percent, respectively, compared to the year-ago period. Mobile apps, the second largest digital payment mode by volume, accounted for 62,958 million transactions with an aggregate value of Rs 1,52,333 billion during H2 2023. But, as pointed out in the report, a significant number of these mobile payments would have been UPI-based, though, there could be others based on bank accounts, too.
At the same time, with UPI gaining in popularity, debit card transactions have been going down both in volume and value. (see graphic).
Interestingly, the average ticket size for UPI transactions has gradually fallen over time. For example, it was down 8 percent - from Rs 1,648 in H2 2022 to Rs 1,515 in H2 2023. This suggests that UPI is being used for smaller or micro transactions.

UPI transactions comprise person-to-person (P2P) and person-to-merchant (P2M) transactions. Data shows that the dip in the average ticket size for UPI transactions is being primarily driven by the growth in P2M transactions.
The top merchant code categories (MCC) for P2M UPI transactions include groceries and supermarkets, eating places and restaurants, telecommunication services, fast food restaurants, department stores, etc. As per the report, the dominance of these categories explains why the average ticket size for UPI transactions has been reducing while their volumes have been increasing.
Payments acceptance infrastructure expandsThe success of digital payments relies on the backing of a robust infrastructure system. The rise in digital payments in India has been supported by the growth in payments acceptance infrastructure channels. Between July and December 2023, point of sale (PoS) terminals grew 5.4 percent to 8.56 million while UPI QR (quick response) codes grew 13 percent to 317 million.
Compared with PoS machines, QR code printouts offer merchants a cheaper alternative for accepting payments, and for customers, a quicker way to make payments.
The leading commercial banks are the top deployers of PoS machines – Axis Bank (19 percent), ICICI Bank and HDFC Bank (18 percent each), SBI (15 percent), RBL Bank (11 per cent) and Paytm Payments Bank (8 percent). Overall, private sector banks dominate this space with a 73 percent market share.
Leading UPI appsAs per the Worldline India report, the three dominant UPI apps in India are PhonePe, Google Pay, and Paytm, both in terms of volume and value of transactions (see graphic). “The dominance is likely a mixture of early mover advantage as well as ease of use and features/discounts/deals offered on the apps,” says the report.
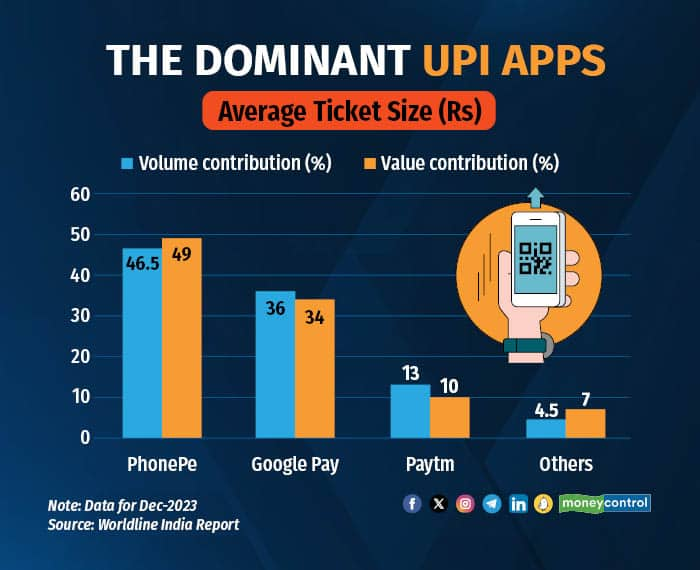
Note that, this is based on data for July-December 2023, that is, before the RBI action on Paytm Payments Bank. Data for subsequent periods may reflect the impact of this action on Paytm’s UPI market share.
Other payment modes and where they are headedCompared to UPI payments, net banking transactions have a significantly higher average ticket size. According to the report, net banking includes not only payments for goods and services but also tax payments by corporates, thereby explaining their very high numbers.
But given their high base effect, the percentage growth of net banking transactions is expected to lag that of UPI transactions.
As per the report, 1.38 billion cards - 97.9 million credit cards, 960.8 million debit cards and 325 million prepaid cards - had been issued as of December 2023 by all the banks put together. Credit card, debit card and prepaid card issuances grew by 21 percent, 2 percent and 13 percent, respectively, in H2 2023 compared to H2 2022 (year-on-year growth).
In contrast with card issuances, the volume of total card transactions fell 7 percent (year-on-year) to 3.70 billion in H2 2023. This fall was driven primarily by debit cards. Credit card transactions, on the other hand, saw an upswing.
But as the report says, given the recent notifications from the RBI on credit cards such as those relating to co-branded cards, penalties for late payments etc., it remains to be seen whether credit card issuances and transactions will get impacted negatively.
Discover the latest Business News, Sensex, and Nifty updates. Obtain Personal Finance insights, tax queries, and expert opinions on Moneycontrol or download the Moneycontrol App to stay updated!
Find the best of Al News in one place, specially curated for you every weekend.
Stay on top of the latest tech trends and biggest startup news.


