It was yet another volatile session for the market, but the up-move in the later part of the session helped the benchmark indices close higher for the fourth straight day on May 30. Traders and investors may be awaiting Q4FY23 GDP numbers, and the vote by US Congress on the debt ceiling deal scheduled on May 31.
The BSE Sensex surged over 120 points to 62,969, while the Nifty50 jumped 35 points to 18,634, forming a small-bodied bullish candlestick pattern with upper and lower shadows on the daily charts.
The Bank Nifty has formed decent bullish candlestick pattern on the daily scale with holding previous day's low levels. The index rose more than 120 points to 44,436, while the Nifty Midcap and Smallcap 100 indices gained around 0.2 percent each.
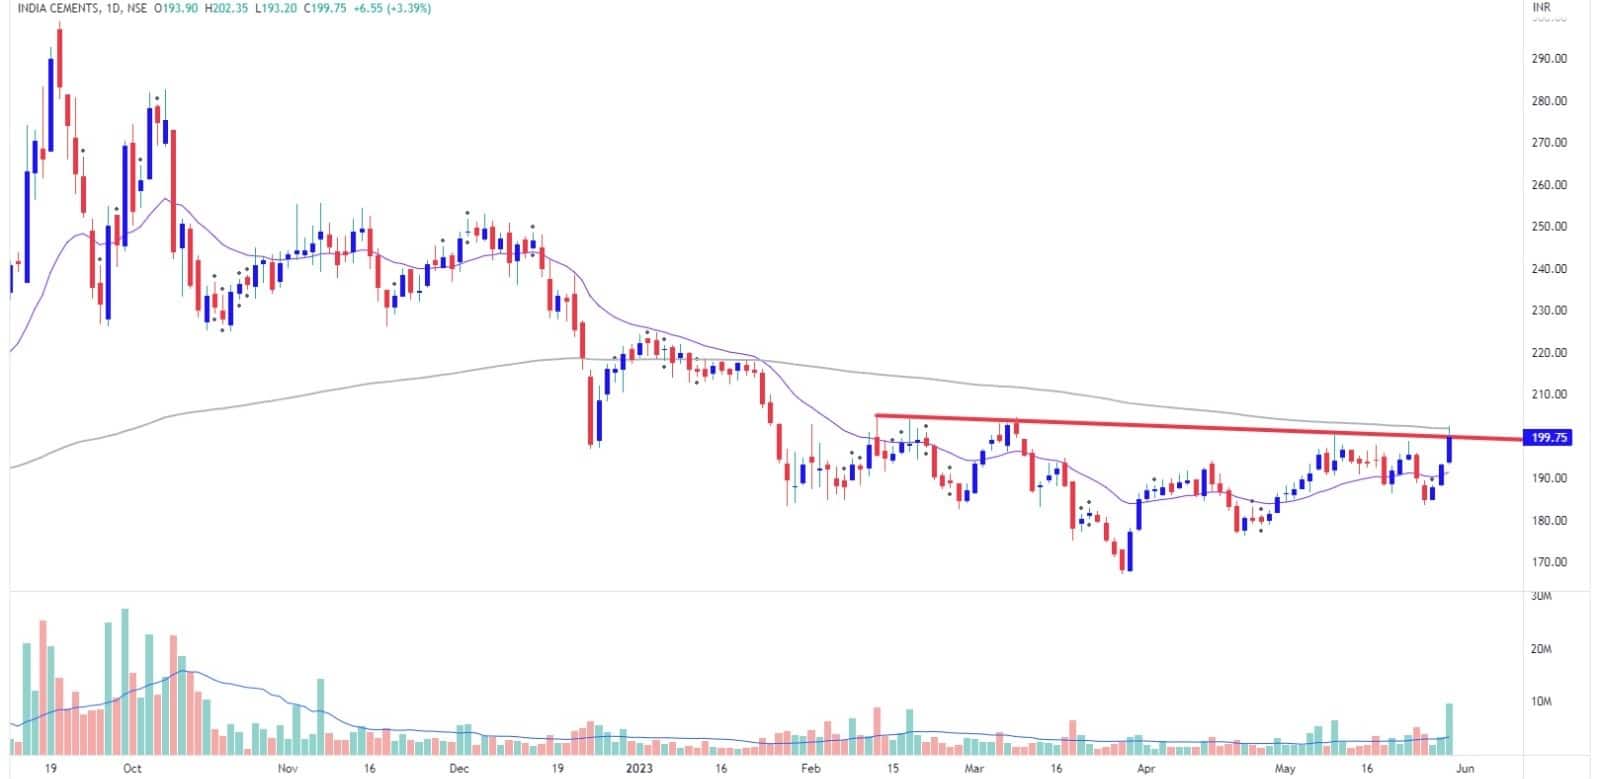
Stocks that performed better than broader markets included India Cements which climbed more than 3 percent to Rs 200 and formed bullish candlestick pattern on the daily charts, continuing the uptrend for the third consecutive session. The stock has seen a breakout of long downward sloping resistance trendline adjoining highs of September 20, 2022 and May 23, 2023.
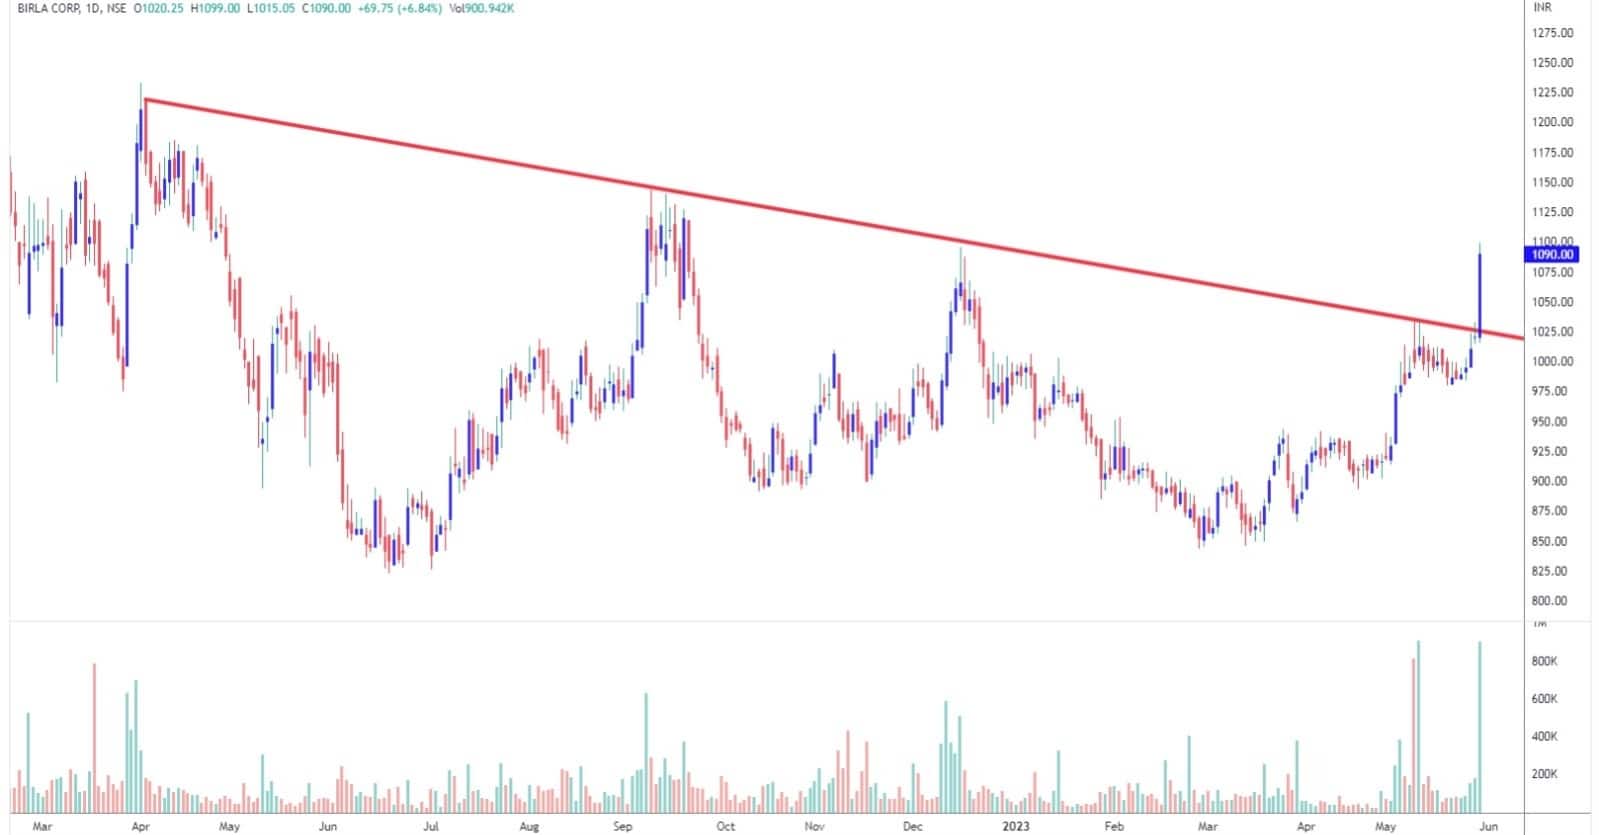
Birla Corporation shares rallied 7 percent to Rs 1,092, the highest closing level since September 20 last year and formed robust bullish candlestick pattern on the daily charts with significantly higher volumes. The stock has been making higher highs, higher lows for third consecutive session.
Orient Electric rose over 3 percent to Rs 241.35, the highest closing level since April 5 this year, and formed bullish candlestick pattern on the daily timeframe, with strong volumes. After taking support around Rs 215-216 levels, the stock has seen good rebound in last few days.
Here's what Rohan Shah of Stoxbox recommends investors should do with these stocks when the market resumes trading today:
The stock has plummeted almost 44 percent from its 52-week high of Rs 298 levels. At the bottom of the trend, the stock has seen forming an Inverse Head & Shoulder price pattern which is a trend reversal pattern.
The stock is currently placed around the neckline of the pattern which also coincides with 200 DEMA (day exponential moving average). Thus going ahead, a move past Rs 202 shall provide a confirmation of the said pattern and would open the way for Rs 214, followed by Rs 225.
On the flip side, Rs 190-188 zone is expected to act key support for the stock.
The stock has been facing stiff resistance from last many months and in Tuesday's session price registered a decisive breakout from the falling resistance trendline with supportive volumes and momentum, which is bullish sign for short term trend.
Going ahead, the stock is expected to do well and we anticipate an upside towards Rs 1,150-1,215, whereas on downside, the support zone is placed Rs 1,065-1,040 levels.
On the weekly chart, the stock has seen forming a potential bullish Wolfe Wave pattern which hints price has formed a tradeable bottom and is recent through to act strong support in near term.
According to the pattern, we sense in the medium to long term, price to gradually trend higher towards the target line (red line marked with 6) which is placed around Rs 285-290 zone. The short term hurdle is expected around Rs 250-255 zone. The support is visible around Rs 227-224 zone.

Disclaimer: The views and investment tips expressed by investment experts on Moneycontrol.com are their own and not those of the website or its management. Moneycontrol.com advises users to check with certified experts before taking any investment decisions.
Discover the latest Business News, Sensex, and Nifty updates. Obtain Personal Finance insights, tax queries, and expert opinions on Moneycontrol or download the Moneycontrol App to stay updated!
Find the best of Al News in one place, specially curated for you every weekend.
Stay on top of the latest tech trends and biggest startup news.