


The market staged a stellar performance on the first day of the week with the benchmark indices making 1.4 percent gains on July 18, backed by banking and financial services, IT and metal stocks. Positive global cues also supported the market sentiment.
The BSE Sensex rallied 760 points to close above the 54,500 levels, while the Nifty50 jumped more than 200 points to 16,278, the highest closing level since June 9.
The broader markets, too, joined the benchmarks as the Nifty Midcap 100 and Smallcap 100 indices closed with around 1.5 percent gains each, while volatility cooled down further to 17.16 levels, falling 2.48 percent and paving the way for bulls to charge.
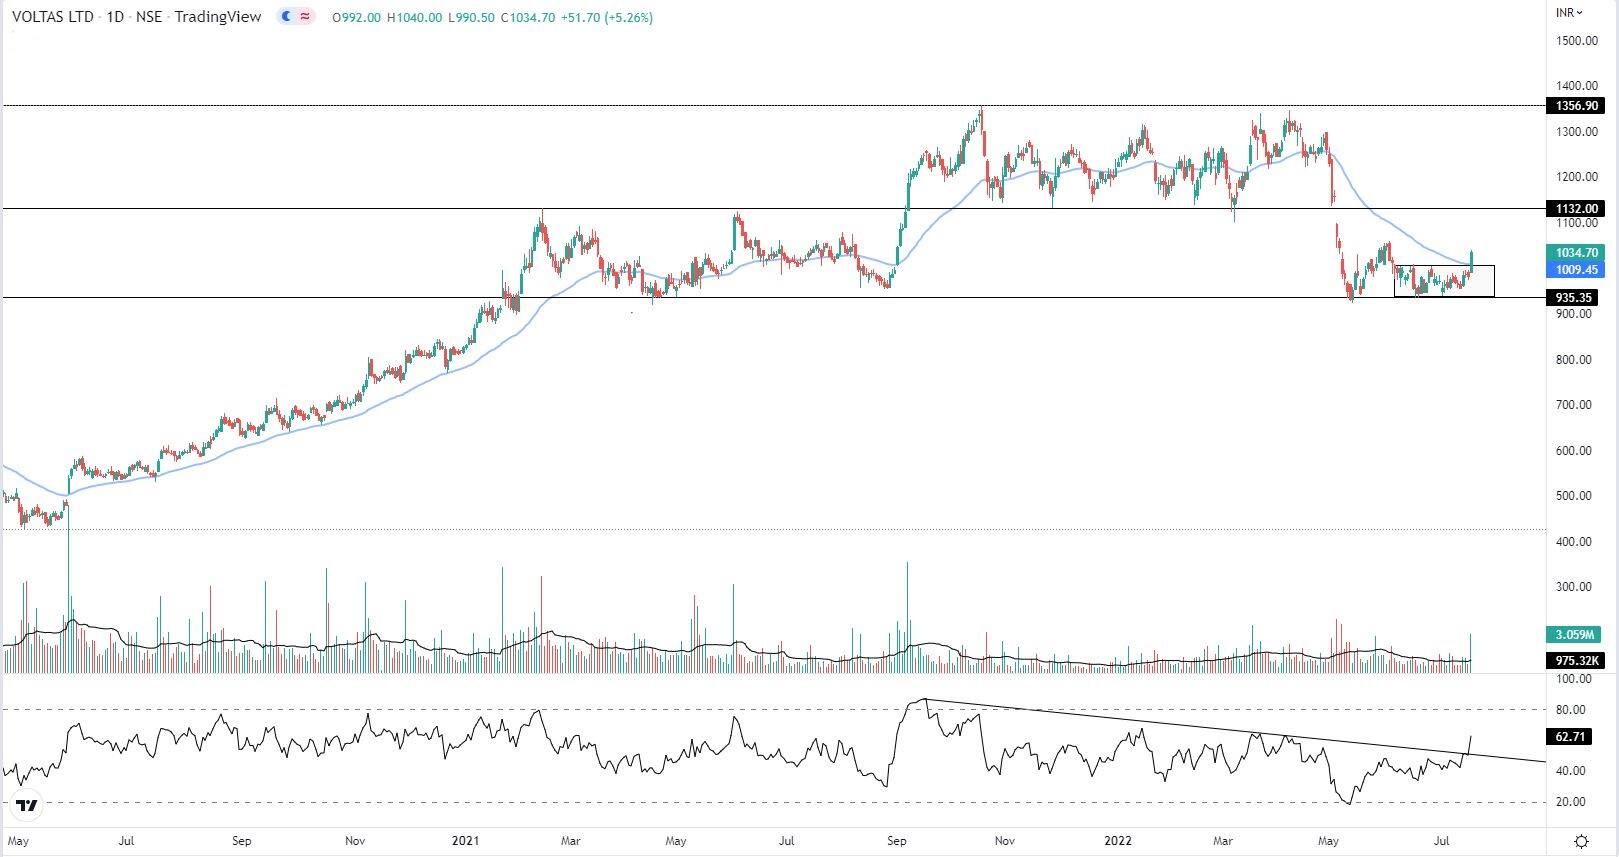
Stocks that were in action included Voltas which climbed 5.3 percent to Rs 1,034.7, the highest level since June 2 and formed a strong bullish candle on the daily charts with significantly higher volumes.
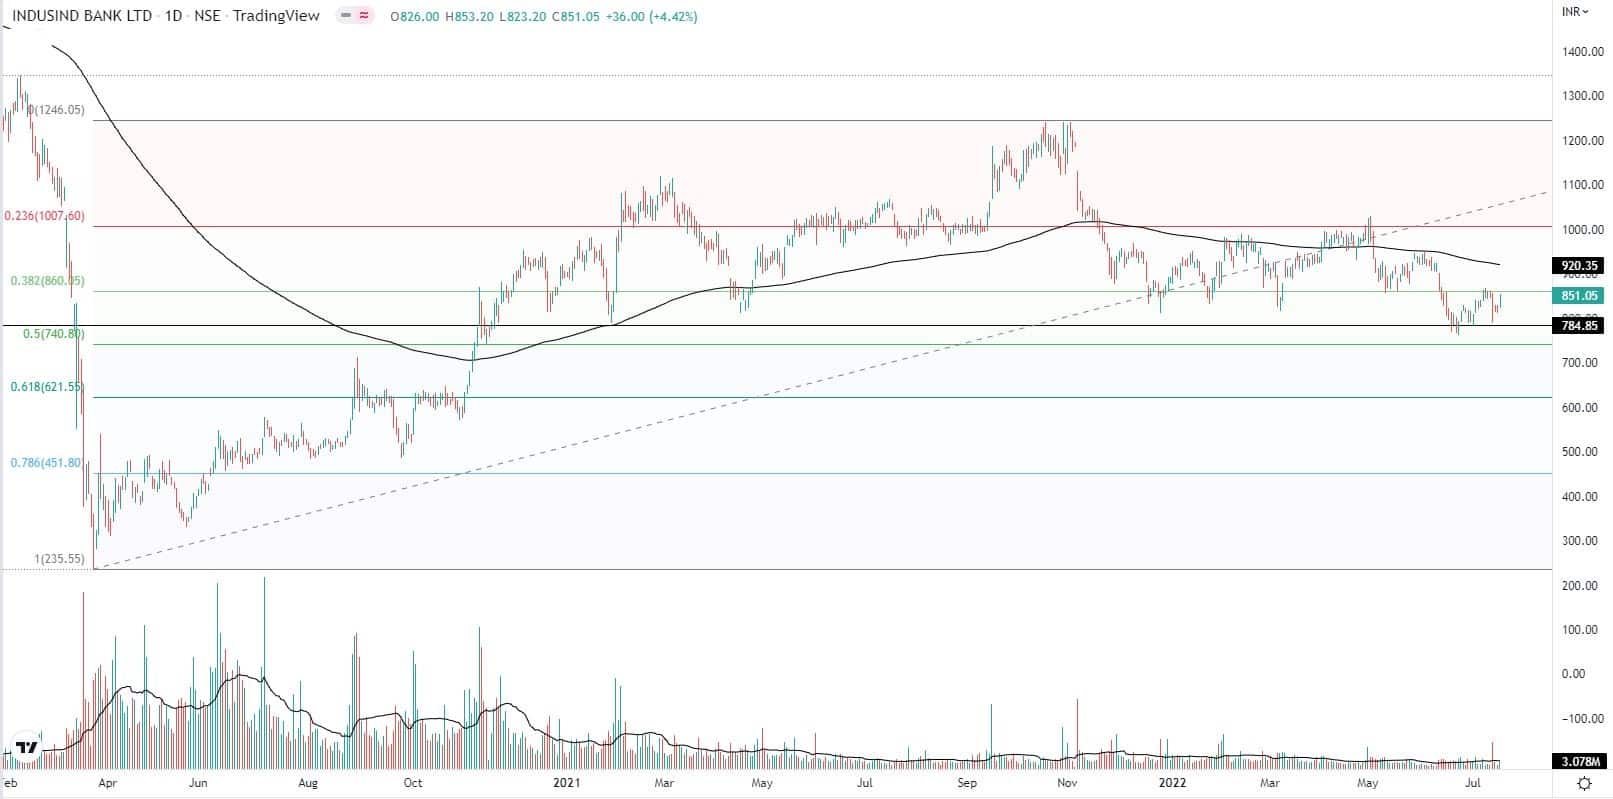
IndusInd Bank was the second biggest gainer in the Nifty50, rising 4.4 percent to Rs 851 and formed a bullish candlestick pattern on the daily charts, while RBL Bank rose nearly 5 percent to Rs 85.9 and formed bullish candle on the daily charts with below average volumes.


Here's what Vidnyan Sawant of GEPL Capital recommends investors should do with these stocks when the market resumes trading today:
On daily time frame of Voltas, we can spot that prices have shown a bounce from its crucial level of Rs 935, this level has acted as multiple touch point to the prices.
Prices from June 7, 2022 had formed a small base which in the latest trading session has given a breakout, here it indicates bullishness in the prices as the breakout is also followed by high volumes.
Prices have also have crossed 50 days EMA (exponential moving average) which can be used as a signal in the trend reversal to the upside.
RSI (relative strength index) plotted on the daily time frame has also given a breakout and is forming higher highs, higher lows,a which indicates that the prices are having strong momentum in it.
Going ahead we expect the prices to rise higher till the level of Rs 1,132 level followed by Rs 1,356 level.
We recommend traders and investors to buy and accumulate the stocks with a stop-loss of Rs 930, strictly on the closing basis.
Since November 2020, prices of IndusInd Bank are moving in a broader range of Rs 1,246 – Rs 785 level, which indicates that the prices are in sideways trend.
Prices are currently taking support from the level around Rs 785 which has acted as a multiple touch point for the prices and the level around Rs 785 is in sync with 50 percent Fibonacci retracement of the advance from Rs 235 (March 2020) to Rs 1,246 (October 2021).
Prices are currently trading below the 200 days moving averages while protecting its crucial support of Rs 785 level.
Going ahead, we expect the prices to rise till the level of Rs 920, until the level of Rs 785 is protected on the downside. We recommend traders and investors to hold this stock with the stop-loss of Rs 740, strictly on the closing basis.
On daily time frame we can spot that the overall trend in RBL bank is on the downside. On June 13, 2022 prices crossed below its crucial support of Rs 101.55. The level of Rs 101.50 was broken on the downside with the strong volume and a Gap, which indicates bearish sentiment in the prices.
Prices are currently below 200 days EMA whereas the prices and the EMA are falling, which confirms the prior breakdown. At the same time prices have also given a breakdown of rounding top pattern which is a bearish pattern, while taking resistance from the down trending trendline. The pattern was forming since April 2020.
RSI plotted on daily and weekly time frame is below 50 mark, which tells that the prices have lower momentum in it. We recommend the trader and investors to sell this stock until the level of Rs 115 is protected on the upside.

Disclaimer: The views and investment tips expressed by investment experts on Moneycontrol.com are their own and not those of the website or its management. Moneycontrol.com advises users to check with certified experts before taking any investment decisions.
Discover the latest Business News, Sensex, and Nifty updates. Obtain Personal Finance insights, tax queries, and expert opinions on Moneycontrol or download the Moneycontrol App to stay updated!
Find the best of Al News in one place, specially curated for you every weekend.
Stay on top of the latest tech trends and biggest startup news.


