


The market seems to be on a strong footing as the benchmark Sensex reclaimed the psychological 60,000 mark and the Nifty 18,000 level on October 31 with all sectors participating in the rally.
The BSE Sensex gained nearly 800 points to 60,746, and the Nifty50 more than 200 points to 18,012, and formed a bullish candlestick pattern on the daily charts, taking total gains to more than 6 percent in last fortnight of October.
The Nifty Midcap 100 also joined the bull run, rising 1.4 percent but the Smallcap 100 index underperformed all these major indices, rising 0.13 percent due to tepid breadth. About 1,084 shares advanced against 916 falling shares on the NSE.
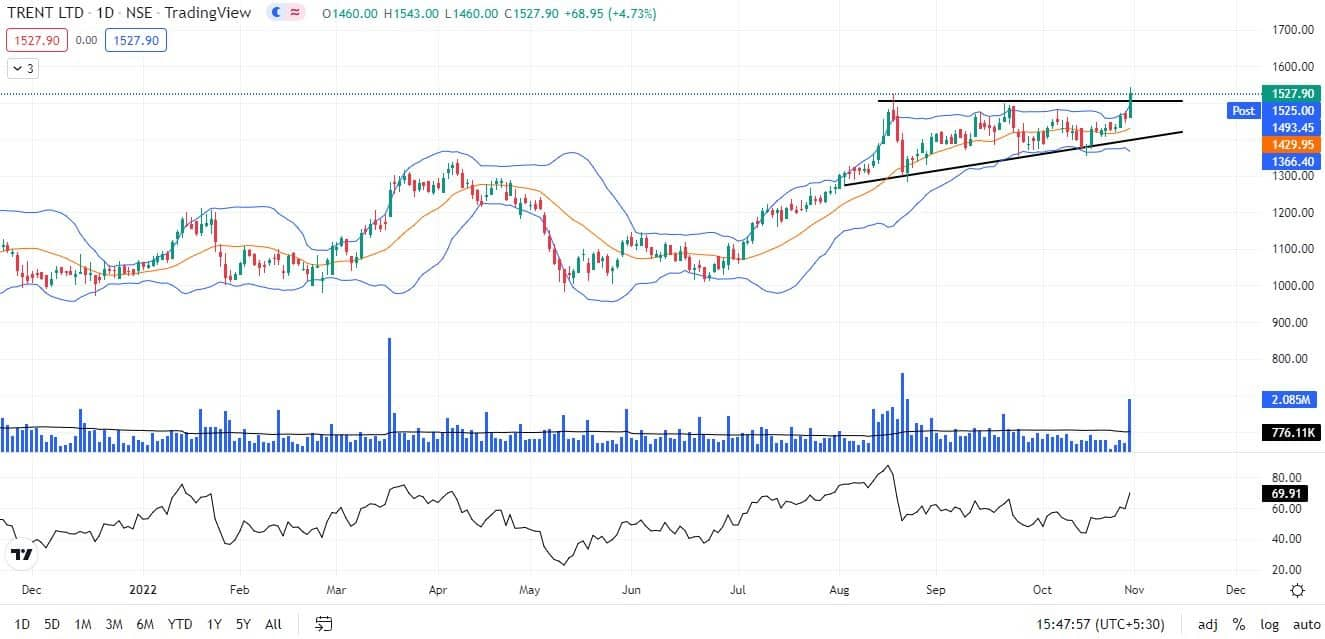
Stocks that were in action included Trent which was the biggest gainer in the futures and options segment, rising nearly 5 percent to end at a record closing high of Rs 1,528. The stock has seen a bullish candlestick pattern formation with robust volumes, making higher highs and higher lows for the third straight session.
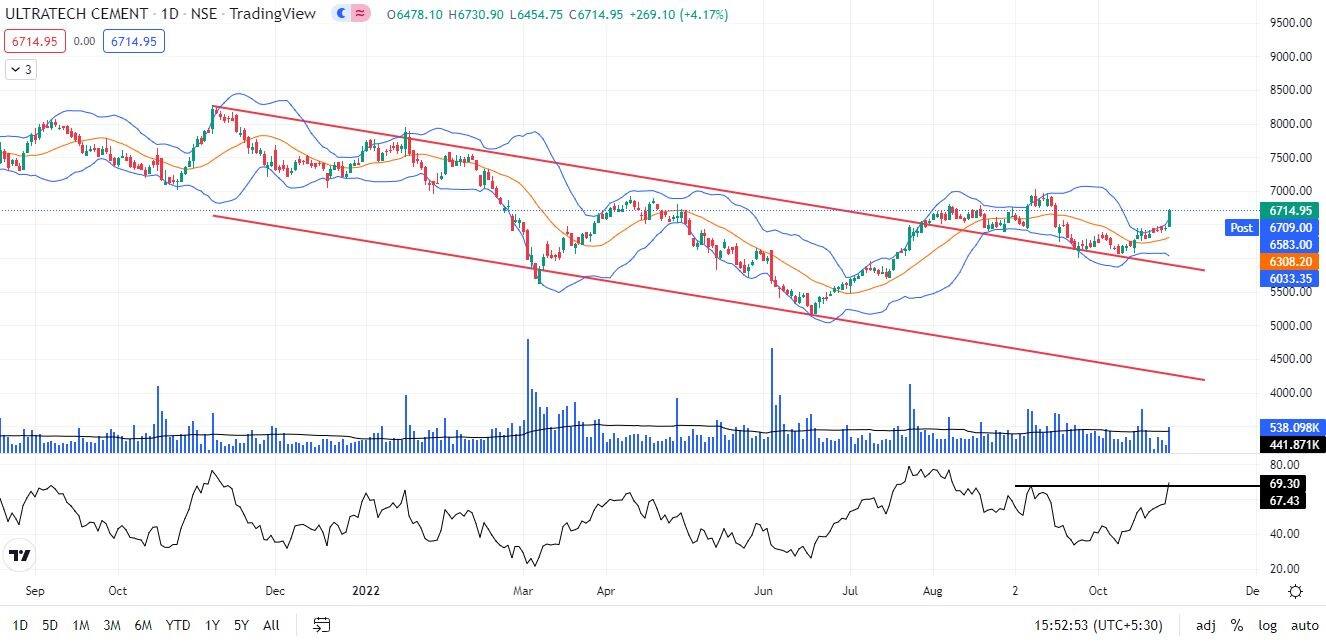
Cement stocks were also buzzing on Monday, with UltraTech Cement rising more than 4 percent to Rs 6,715. The stock has formed big bullish candle on the daily charts with above average volumes.
Karur Vysya Bank shares rallied 6 percent to Rs 104, the highest closing level since February 12, 2018 and formed strong bullish candle on the daily charts with healthy volumes.
Here's what Vidnyan Sawant of GEPL Capital recommends investors should do with these stocks when the market resumes trading today:
Trent is currently trading at its record high level which tells that the stock already is in a strong momentum while maintaining its higher top, higher bottom formation.
Prices in the latest trading session (Friday) have given a breakout of the Ascending Triangle pattern, indicating continuation of the prior uptrend.
The stock has also witnessed change in its polarity around the level of Rs 1,345, which confirms the uptrend.
The stock has come out of a broader range with the expansion of Bollinger band, indicates the rising volatility of the stock. The breakout is confirmed as it is accompanied by rising volumes.
RSI (relative strength index) plotted on the daily timeframe is at the highest level since September 2022 which reflects the rising momentum in the stock.
We recommend traders and investors to buy this stock for the target of Rs 1,800 where the stop-loss must be Rs 1,410 strictly on the closing basis.
By looking at the broader picture of UltraTech Cement, we can spot that the prices now have started to get into higher high, higher low formation, this points towards the reversal from prior downtrend.
Prices have shown a bounce on upside post the breakout of bearish Channel on July 27, 2022. This confirms the trend is reversing while indicating change in its polarity by the prices.
Bollinger band plotted on the daily timeframe have opened with good volume participation pointing towards the rising volatility of the underlying.
The prices are currently quoting below the swing high of Rs 7,029 (September 2022), while the RSI is above the swing high of corresponding price, which reflects the strong momentum in the prices.
We recommend the trader and investors to hold this stock with a strict stop-loss of Rs 6,000.
Karur Vysya Bank, post July 21, 2022 started a strong uptrend while maintaining a clear higher high, higher low formation.
In the last trading session, prices have given a breakout from the rounding bottom pattern, indicating continuation of prior uptrend.
The stock has again started to climb while taking support from the 11 and 23 days EMA (exponential moving average). The 11 and 23 days EMA have acted as a strong variable support for the prices.
MACD (moving average convergence and divergence 11, 23, 9) have shown a positive crossover above zero line indicates strong momentum of the underlying.
Going ahead we expect the prices to go higher till the level of Rs 120 where the stop-loss must be Rs 95 on the closing basis.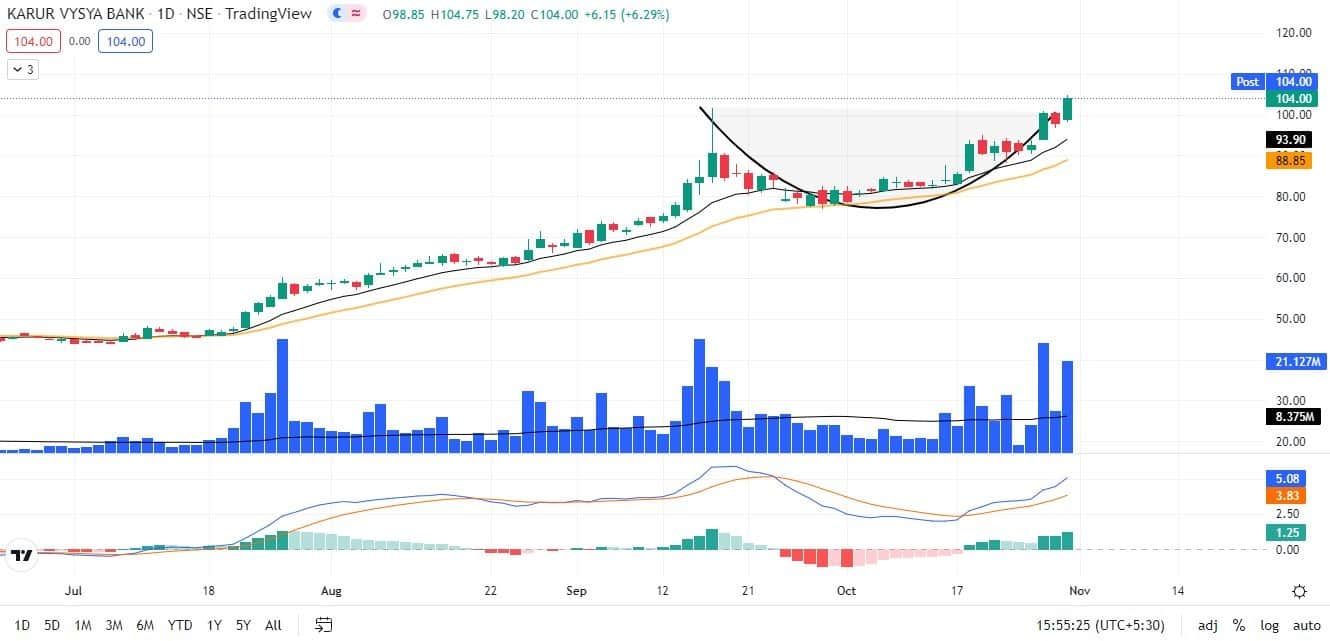
Disclaimer: The views and investment tips expressed by investment experts on Moneycontrol.com are their own and not those of the website or its management. Moneycontrol.com advises users to check with certified experts before taking any investment decisions.
Discover the latest Business News, Sensex, and Nifty updates. Obtain Personal Finance insights, tax queries, and expert opinions on Moneycontrol or download the Moneycontrol App to stay updated!
Find the best of Al News in one place, specially curated for you every weekend.
Stay on top of the latest tech trends and biggest startup news.


