


The sharp rebound after a day of bloodbath helped the market clock 2.5 percent gains on first day of March series, February 25, backed by positive global cues, but the situation in Ukraine remains tensed, which will be closely monitored by investors and traders. Most stocks in the F&O segment saw either long build-up or short covering on Friday, taking the market higher.
The BSE Sensex rallied more than 1,300 points to 55,858, and the Nifty50 jumped over 400 points to 16,658, while the broader market also participated in the run with the Nifty Midcap and Smallcap 100 indices climbing 4.2 percent and 4.8 percent, respectively.
The buying was across sectors with key gainers being Auto, Bank, Financial Services, IT, Metal and Pharma that gained 3-6 percent.
Stocks that were in focus include NBCC and Dixon Technologies which were the top gainers in the futures & options segment, surging 13 percent to Rs 39, and rising nearly 10 percent to Rs 4,434 respectively.
Other stocks that were in action mode include Easy Trip Planners which was locked in 10 percent upper circuit at Rs 549, Fine Organics Industries which rallied more than 8 percent to Rs 4,273 and Sunteck Realty which jumped 9 percent to Rs 484.
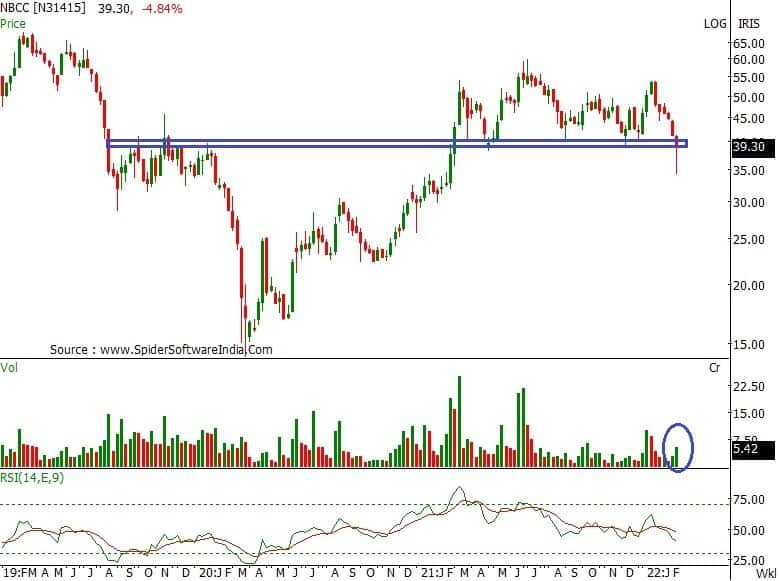
Here's what Rajesh Palviya of Axis Securities recommends investors should do with these stocks when the market resumes trading today:NBCCWith last week's price action, the stock has violated its one year multiple support zone of Rs 38 level on an intra-week basis, however, managed to hold on a closing basis. The weekly price action has formed a small bearish candle and long shadow indicating buying support at lower levels.
Weekly price action resembles to "Hammer" candlestick pattern indicating short term bounce back in the near term. This buying momentum was observed with huge volumes.
As stock is sustaining below its 20, 50 , 100 and 200 day SMA (simple moving average) indicating short term negative bias, hence any relief rally towards Rs 45-48 levels remains as an exit opportunity for short term traders.
Investors should use sell opportunity or exit to rally on any bounce towards Rs 45-48, with downside of Rs 30 levels.
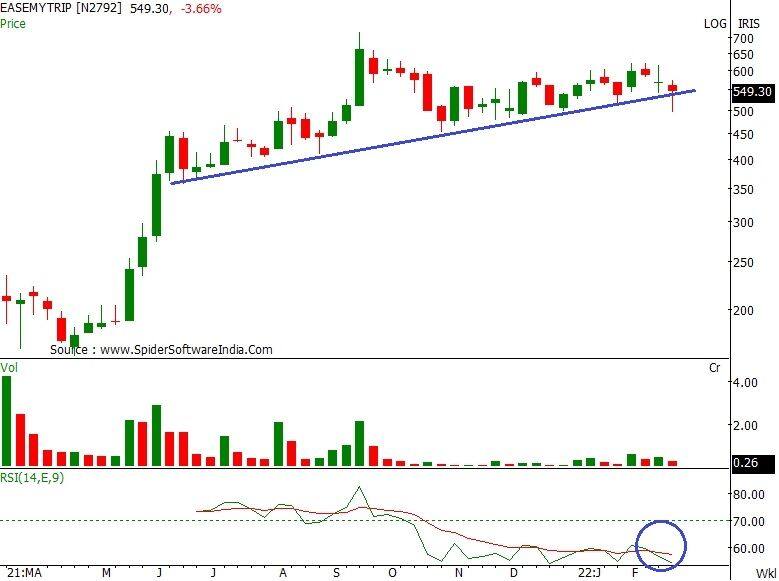
Since October 2021, the stock is consolidating within Rs 620-480 levels representing sideways trend. With last week's low, the stock has breached its one year up-sloping trend line support (Rs 530) on a intraday-week basis indicating further weakness.
The short to medium term trend remains neutral / sideways indicating absence of strength on the either side. Hence weekly close below Rs 480 levels may cause further weakness. The daily and weekly strength indicator RSI (relative strength index) continued to remain weak indicating selling may arise on a bounce back rally.
Investors should use sell opportunity or exit to rally on any bounce towards Rs 580-600, with downside crucial support zone of Rs 490-480 levels.
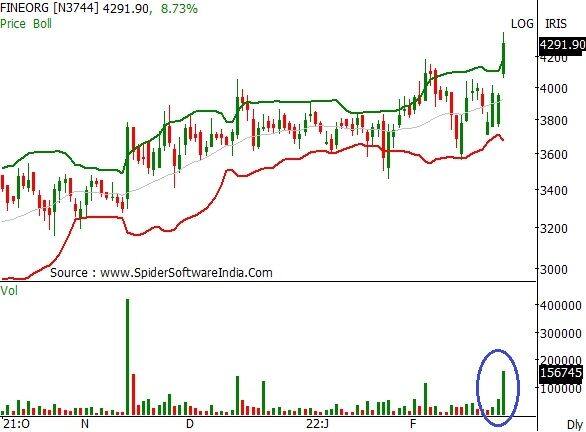
The stock is in strong up trend across all the time frames, as it continued to scale forming a series of higher tops and bottoms. Huge volumes on a rally signifies increased participation on up move. This buying momentum was observed from its 100-day SMA (Rs 3,666) which remains a crucial support zone.
The daily, weekly and monthly "band Bollinger" buy signal indicates increased momentum. The daily, weekly and monthly strength indicator RSI is in bullish mode indicating rising strength.
Investors should buy, hold and accumulate this stock with an expected upside of Rs 240-260, with downside support zone of Rs 200-195 levels.
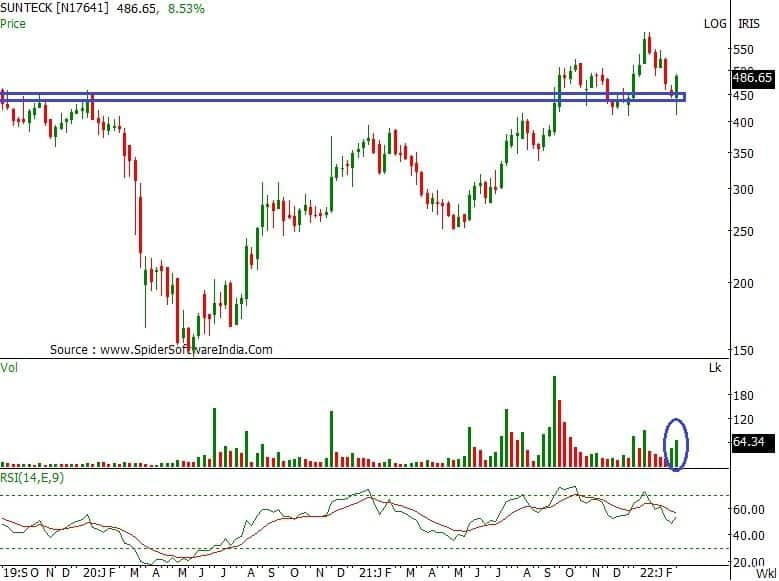
On the weekly and monthly chart, the stock is in strong up trend forming a series of higher tops and bottoms. However with recent downfall the stock has recaptured its 200-day SMA and rebounded sharply. This buying momentum is accompanied with high volumes indicating increased participation near 200-day SMA support zone.
The daily strength indicator RSI is in bullish mode indicating rising strength.
Investors should buy, hold and accumulate this stock with an expected upside of Rs 540-580, with downside support zone of Rs 450-420 levels.
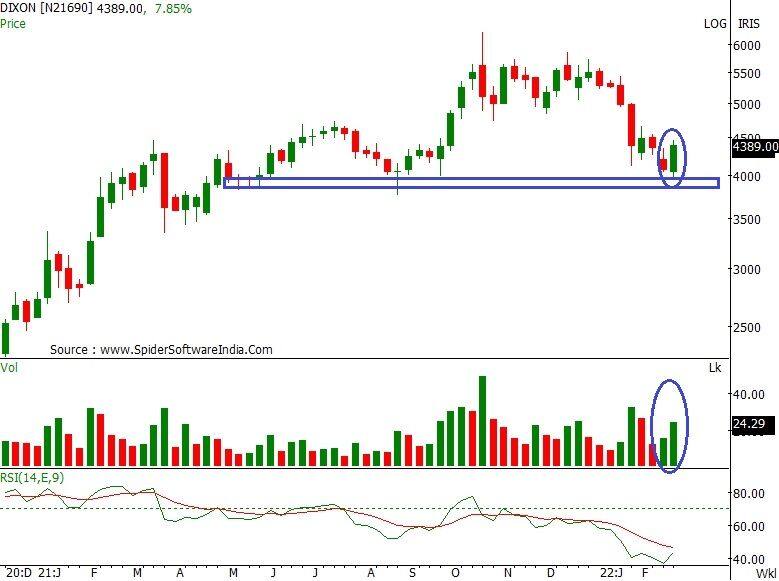
The short term trend remains down, however with last week's gain the weekly price action has resulted in an "Engulfing Bullish" candlestick pattern. This buying momentum was observed from its multiple support zone of Rs 3,950 levels.
Past couple of weeks rising volumes indicate increased participation at lower levels. The daily strength indicator RSI is in bullish mode indicating rising strength.
Investors should use sell opportunity or exit to rally on any bounce towards Rs 4,700-4,900, with downside crucial support zone of Rs 4,120-3,930 levels.
Discover the latest Business News, Sensex, and Nifty updates. Obtain Personal Finance insights, tax queries, and expert opinions on Moneycontrol or download the Moneycontrol App to stay updated!
Find the best of Al News in one place, specially curated for you every weekend.
Stay on top of the latest tech trends and biggest startup news.


