
The benchmark indices Nifty 50 and BSE Sensex closed the session higher for the second consecutive day on May 17, with approximately 1,493 shares advancing and 791 shares declining on the NSE. The market is anticipated to sustain its upward bias in the forthcoming sessions. Here are some trading ideas for the near term.
Pravesh Gour, Senior Technical Analyst at Swastika Investmart
Engineers India | CMP: Rs 262.95

Engineers India has recently broken out of a symmetrical triangle formation on the daily chart, confirming the breakout above Rs 252 levels. Furthermore, the stock is trading above its significant moving averages, which strengthens its bullish sentiment.
Both the RSI (Relative Strength Index) and MACD (Moving Average Convergence Divergence) indicators support the current strength in the stock's momentum.
Regarding key price levels, the range of Rs 275 holds psychological significance as a crucial resistance level. Should the stock surpass this level, it could potentially rally towards Rs 290 or higher. Conversely, during corrective phases, Rs 237 serves as a robust demand zone.
Strategy: Buy
Target: Rs 298
Stop-Loss: Rs 237
Data Patterns India | CMP: Rs 3,188.8

Data Patterns India has recently broken a trendline resistance on the daily chart, signaling a strong bullish setup. After reaching a fresh all-time high, it retraced to retest its previous breakout level of Rs 2,700 before embarking on a new leg of the rally towards Rs 3,400.
On a longer timeframe, the stock has witnessed a breakout of a triangle formation pattern with significant volume, further reinforcing its bullish outlook. The overall structure of the counter appears lucrative, particularly as it continues to trade above all of its moving averages.
Regarding key price levels, Rs 3,400 is a pivotal resistance level on the higher side. A breach above this level could potentially trigger a sustained move towards Rs 3,700 or higher in the shorter to longer timeframe. Conversely, during corrective phases, Rs 2,800 is expected to provide substantial support.
Strategy: Buy
Target: Rs 3,700
Stop-Loss: Rs 2,800
Ircon International | CMP: Rs 267.10

Ircon International has recently broken out of a symmetrical triangle formation on the daily chart, accompanied by significant trading volume. It now finds itself trading in a new blue-sky zone, showcasing an impressive structural setup as it remains above all important moving averages.
The momentum indicator RSI is positively positioned, signaling strength in the current trend. Additionally, the MACD is undergoing a centerline crossover on the upside, further bolstering the bullish momentum.
Regarding key price levels, Rs 281 holds notable psychological significance on the higher side. A breach above this level could potentially propel the stock towards Rs 300 or higher in the near to short term. Conversely, during corrective phases, Rs 245 is anticipated to provide strong support.
Strategy: Buy
Target: Rs 300
Stop-Loss: Rs 245
Cochin Shipyard | CMP: Rs 1,414.85
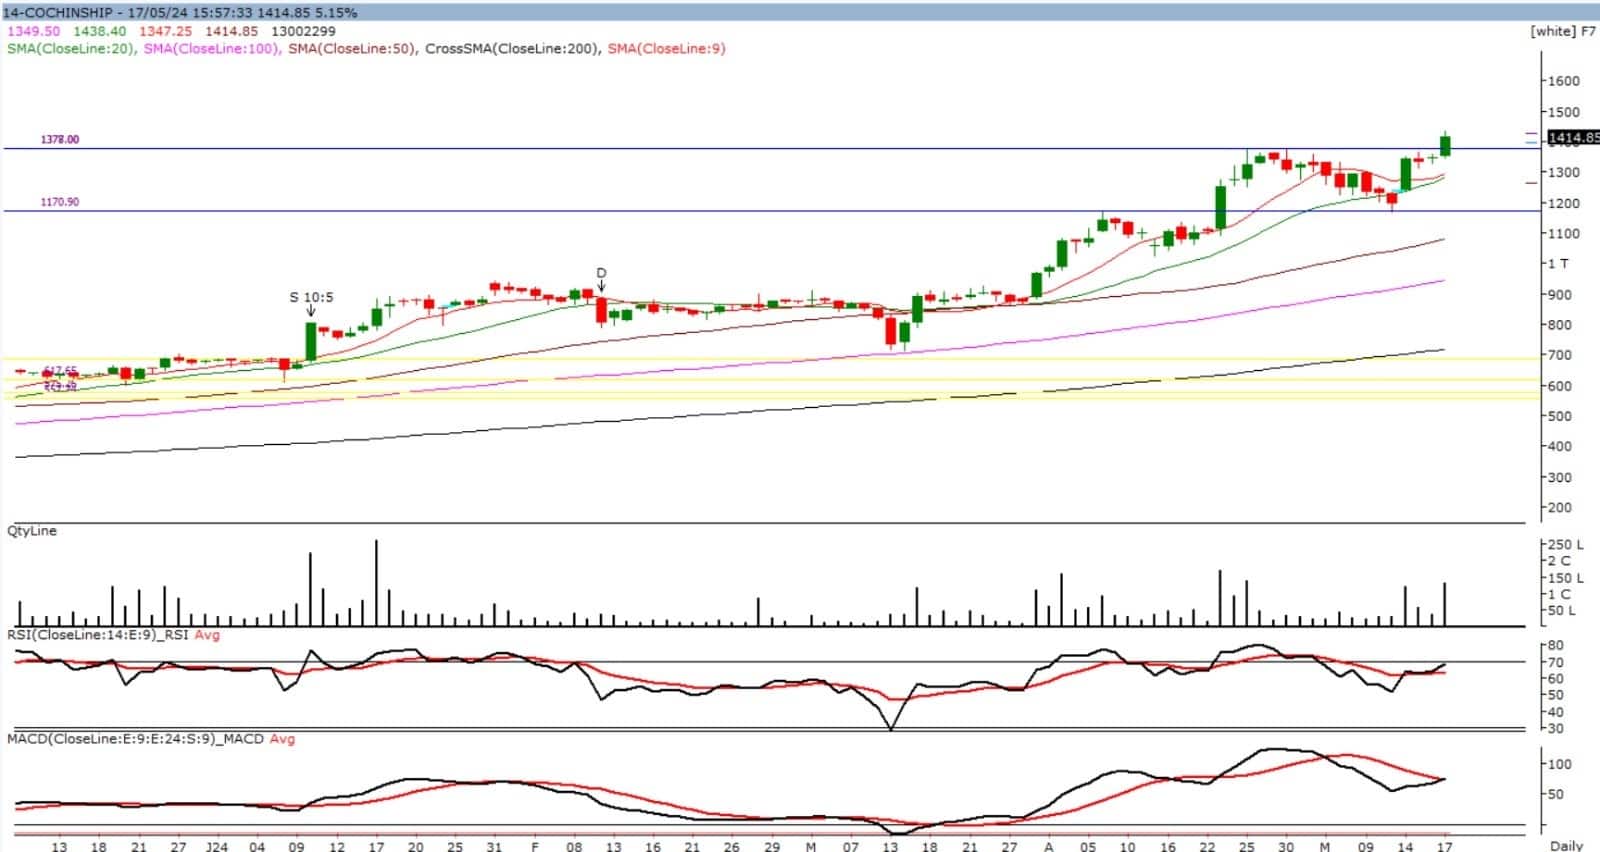
Cochin Shipyard has recently experienced a breakout from a prolonged consolidation formation on the daily chart, accompanied by robust volume. Simultaneously, the weekly chart illustrates a breakout from a Flag formation pattern. This classic structural setup is further confirmed by the stock trading above all significant moving averages.
The MACD indicator has undergone an upward centerline crossover, indicating a potential shift towards bullish momentum. Additionally, the RSI, serving as a momentum indicator, is currently in a positive position.
Regarding price levels, the range of Rs 1,500 holds psychological significance as a key resistance level. A successful breach of this level could potentially propel the stock towards Rs 1,550 or higher. Conversely, during corrective phases, Rs 1,280 acts as a strong demand zone, offering support.
Strategy: Buy
Target: Rs 1,554
Stop-Loss: Rs 1,280
Mehul Kothari, DVP – Technical Research at Anand Rathi
Shriram Finance | CMP: Rs 2,371.60

Shriram Finance recently experienced a downturn, reaching a low near the lower Bollinger band, typically signaling a potential reversal from a downtrend to an uptrend. In the latest trading session, a long-legged Doji candlestick pattern formed precisely at this lower Bollinger band level. This pattern, characterized by a small central body and long wicks on both sides, indicates market indecision and hints at a potential trend reversal, especially when occurring at a support level like the lower Bollinger band.
Moreover, the hourly chart reveals the establishment of a Double Bottom structure, further bolstering the bullish case. Additionally, there is bullish divergence observed in the daily stochastic indicator. Bullish divergence occurs when the stock price reaches a new low, while the stochastic oscillator does not, suggesting weakening downward momentum and a possible reversal in the near future.
Based on these bullish signals, it is advisable to consider purchasing Shriram Finance within the price range of Rs 2,345-2,365. The target price for this trade is Rs 2,460, with a suggested stop-loss set at Rs 2,300 on a daily close basis to mitigate potential losses.
Strategy: Buy
Target: Rs 2,460
Stop-Loss: Rs 2,300
Jubilant Foodworks | CMP: Rs 470.70

Jubilant Foodworks exhibits two significant technical analysis signals: a bullish divergence on the daily MACD indicator and the violation of a bearish trendline that persisted for 3-4 months. A bullish divergence occurs when the stock price forms lower lows while the MACD indicator forms higher lows, suggesting a potential reversal from a downtrend to an uptrend.
The breach of the bearish trendline indicates a possible shift in the stock's direction from bearish to bullish. Based on these signals, we advise investors/traders to consider taking a "long" position in Jubilant Foodworks within the price range of Rs 470-475 per share.
Additionally, an upside target of Rs 526 per share indicates the potential profit opportunity. To manage risk effectively, a stop-loss is recommended to be placed near Rs 445 per share, on a daily closing basis.
Strategy: Buy
Target: Rs 526
Stop-Loss: Rs 445
Titan Company | CMP: Rs 3,361.15

Since peaking around the Rs 3,800 mark on April 1, 2024, Titan has undergone a significant downturn, experiencing a nearly 600 rupee decline, equating to a 16 percent loss in price. However, amidst this downturn, a compelling opportunity has emerged. Presently, the market exhibits a Bullish AB=CD Pattern with a 1:1 leg ratio, signaling a potential reversal near the Rs 3,200-3,250 zone. This pattern, coupled with a noteworthy observation from the RSI, adds to the allure of the current juncture. The RSI indicator reveals a complex structure resembling a W shape within the oversold zone, suggesting a robust potential for an upward price movement.
Given these favourable technical indications, investors are encouraged to consider buying within the Rs 3,330-3,365 zone, with an optimistic target set at Rs 3,600. To safeguard against adverse price movements, it's advisable to implement a stop-loss order at Rs 3,235, based on daily closing prices.
Strategy: Buy
Target: Rs 3,600
Stop-Loss: Rs 3,235
Riyank Arora, Technical Analyst at Mehta Equities
National Aluminium Company (NALCO) | CMP: Rs 194.85
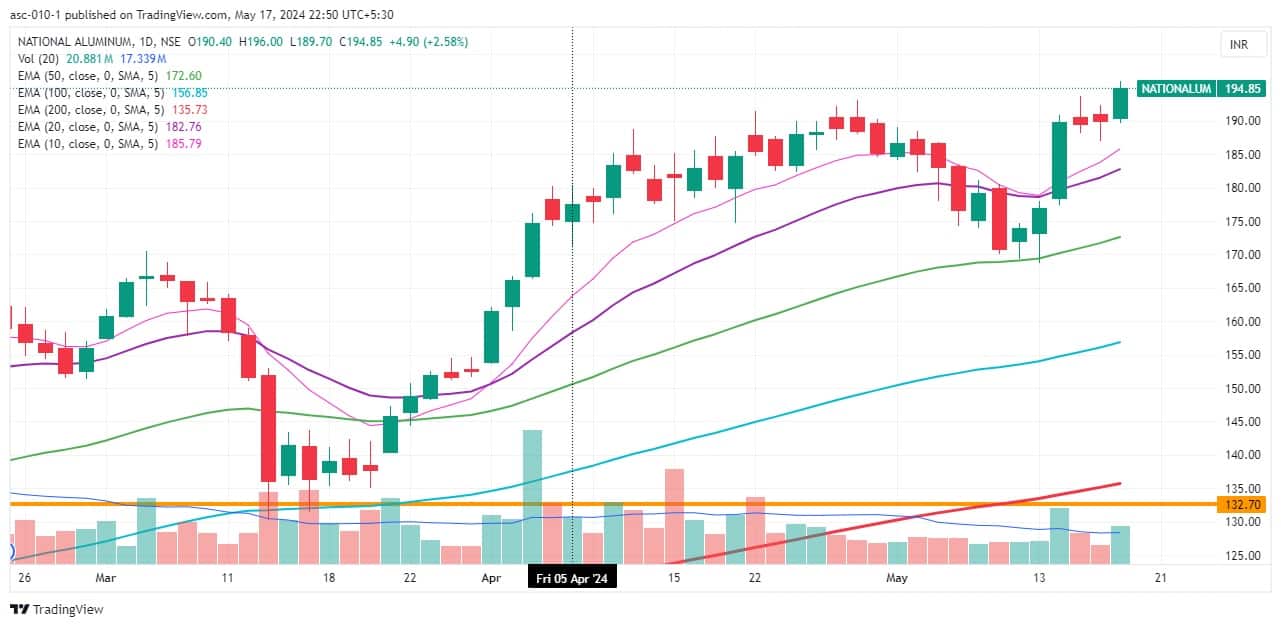
National Aluminium Company has sharply broken above its all-time high resistance level of Rs 193.70 and has closed above this threshold. The trading volume matches its 30-day average, and the RSI on the daily charts is around 66, indicating strong momentum. This suggests the stock is well-positioned for an upward move towards Rs 210 and potentially higher.
However, it's essential to maintain a strict stop-loss at Rs 190 to effectively manage risk.
Strategy: Buy
Target: Rs 210
Stop-Loss: Rs 190
IRCTC | CMP: Rs 1,093.7

IRCTC has experienced a strong breakout above its 52-week high resistance mark of Rs 1,076.45 and has successfully closed above this level. With volumes nearly 2 times its average (30 days) traded value and the RSI (14) hovering around 68, the overall momentum appears robust, indicating that the stock is poised for an upside move towards Rs 1,200 and beyond.
To effectively manage risk, it's crucial to maintain a strict stop-loss at the Rs 1,060 mark.
Strategy: Buy
Target: Rs 1,200
Stop-Loss: Rs 1,060
Bharat Electronics | CMP: Rs 248.2

Bharat Electronics has experienced a significant breakout above its all-time high resistance mark of Rs 241.65 and has successfully closed above this level. Volumes have surged to almost 3.5 times its average (30 days) volume, and the RSI (14) has crossed the 70 mark, indicating strong momentum. Consequently, the stock is expected to advance towards Rs 265 and beyond.
To effectively manage risk, it's crucial to maintain a strict stop-loss at the Rs 240 mark.
Strategy: Buy
Target: Rs 265
Stop-Loss: Rs 240
Disclaimer: The views and investment tips expressed by investment experts on Moneycontrol.com are their own and not those of the website or its management. Moneycontrol.com advises users to check with certified experts before taking any investment decisions.
Discover the latest Business News, Sensex, and Nifty updates. Obtain Personal Finance insights, tax queries, and expert opinions on Moneycontrol or download the Moneycontrol App to stay updated!
Find the best of Al News in one place, specially curated for you every weekend.
Stay on top of the latest tech trends and biggest startup news.


