


The benchmark indices corrected sharply for the third straight session, with the Nifty 50 falling 1.55 percent as participants remained cautious amid the US-Iran conflict. Market breadth remained firmly in favour of bears, with 2,439 shares declining compared to 525 advancing shares on the NSE. Bears are likely to maintain the upper hand, though there is a possibility of a bounce-back. Below are some short-term trading ideas to consider:
Ashish Kyal, Founder and CEO of Waves Strategy Advisors
Chennai Petroleum Corporation | CMP: Rs 999.9
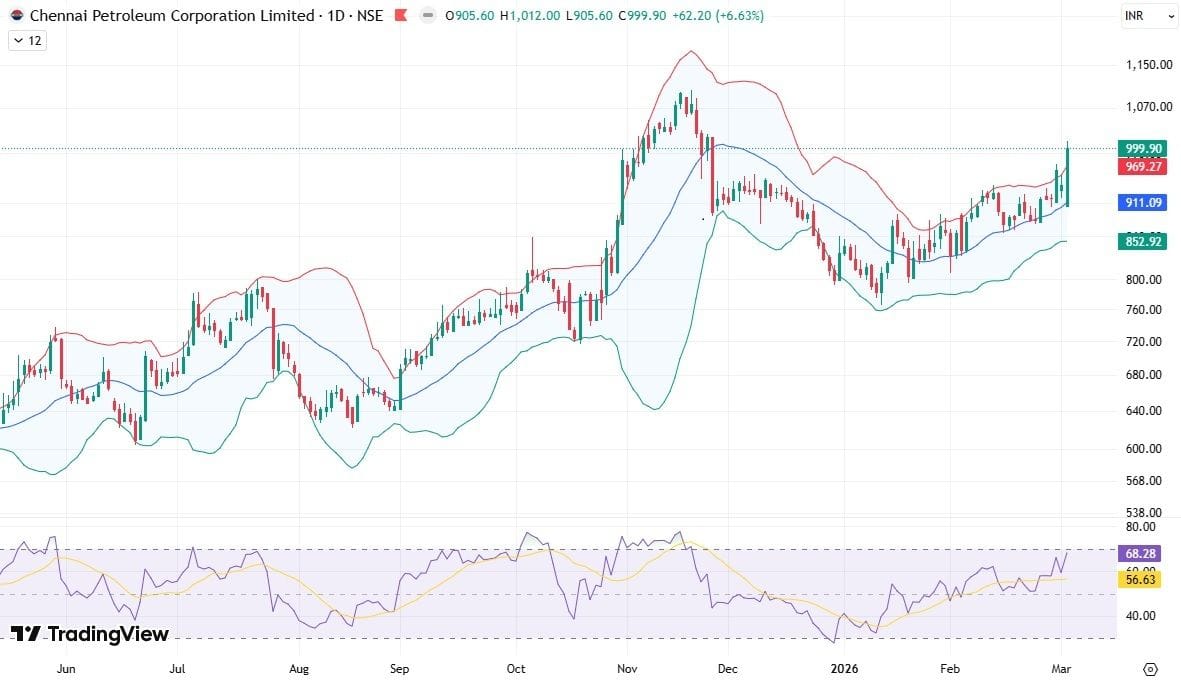
On the daily chart, Chennai Petroleum Corporation has been moving in a higher highs and higher lows formation, indicating sustained bullish momentum. The stock has also outperformed the broader indices, closing with a gain of over 6 percent, highlighting strong relative strength.
Additionally, the stock has protected its lows for the past six trading sessions on a closing basis, providing further confirmation of ongoing strength. Prices have also broken above the upper Bollinger Band, signalling strong momentum.
The RSI is currently trading around 68, indicating strengthening bullish momentum. For now, dips towards Rs 975 can be used as an opportunity to ride the ongoing trend, as long as the Rs 930 level remains protected on the downside, with resistance placed around Rs 1,050.
Strategy: Buy
Target: Rs 1,050
Stop-Loss: Rs 930
Balrampur Chini Mills | CMP: Rs 491.7
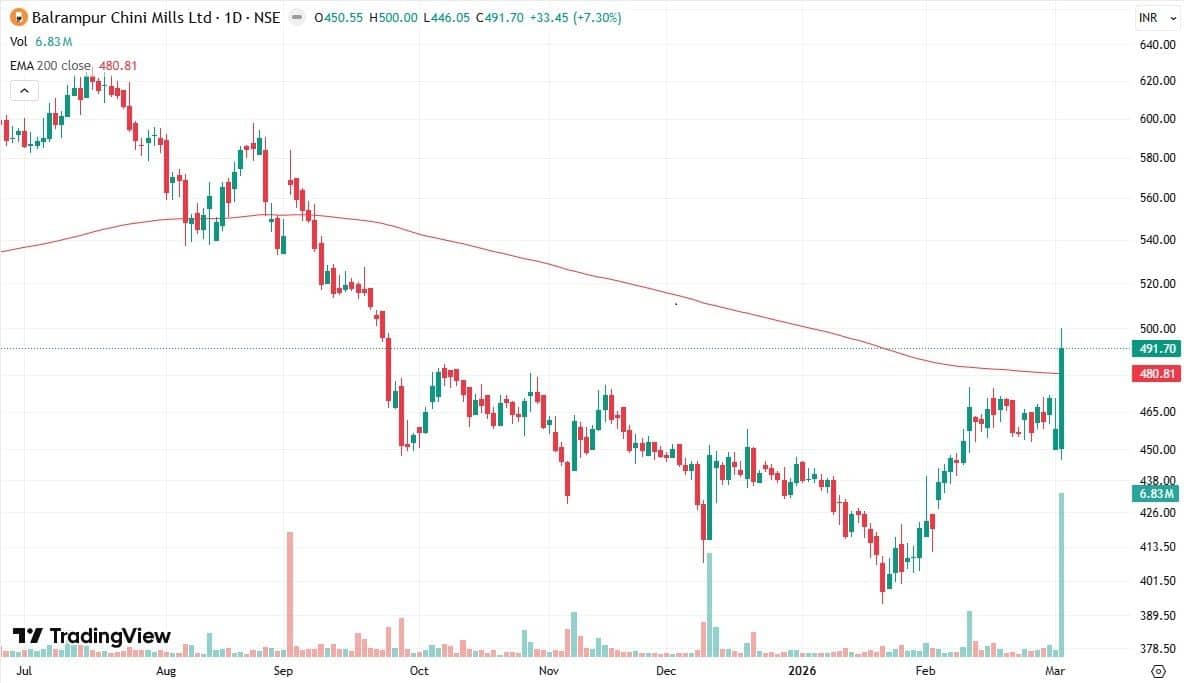
Balrampur Chini Mills had been facing resistance in the Rs 470–475 zone for the past three weeks, and in the previous session, the stock finally gave a breakout above this level with a significant increase in volumes, recording the highest levels since September 27, 2024, which strengthens the validity of the move.
Additionally, prices have closed above this zone, which is a significant positive development. However, follow-up buying is required for confirmation.
The sharp rally has pushed most oscillators near the overbought zone. Therefore, dips towards Rs 480 may provide a buying opportunity, with targets of Rs 530 or higher, as long as the Rs 455 level remains protected on the downside.
Strategy: Buy
Target: Rs 530
Stop-Loss: Rs 455
National Aluminium Company | CMP: Rs 373.5
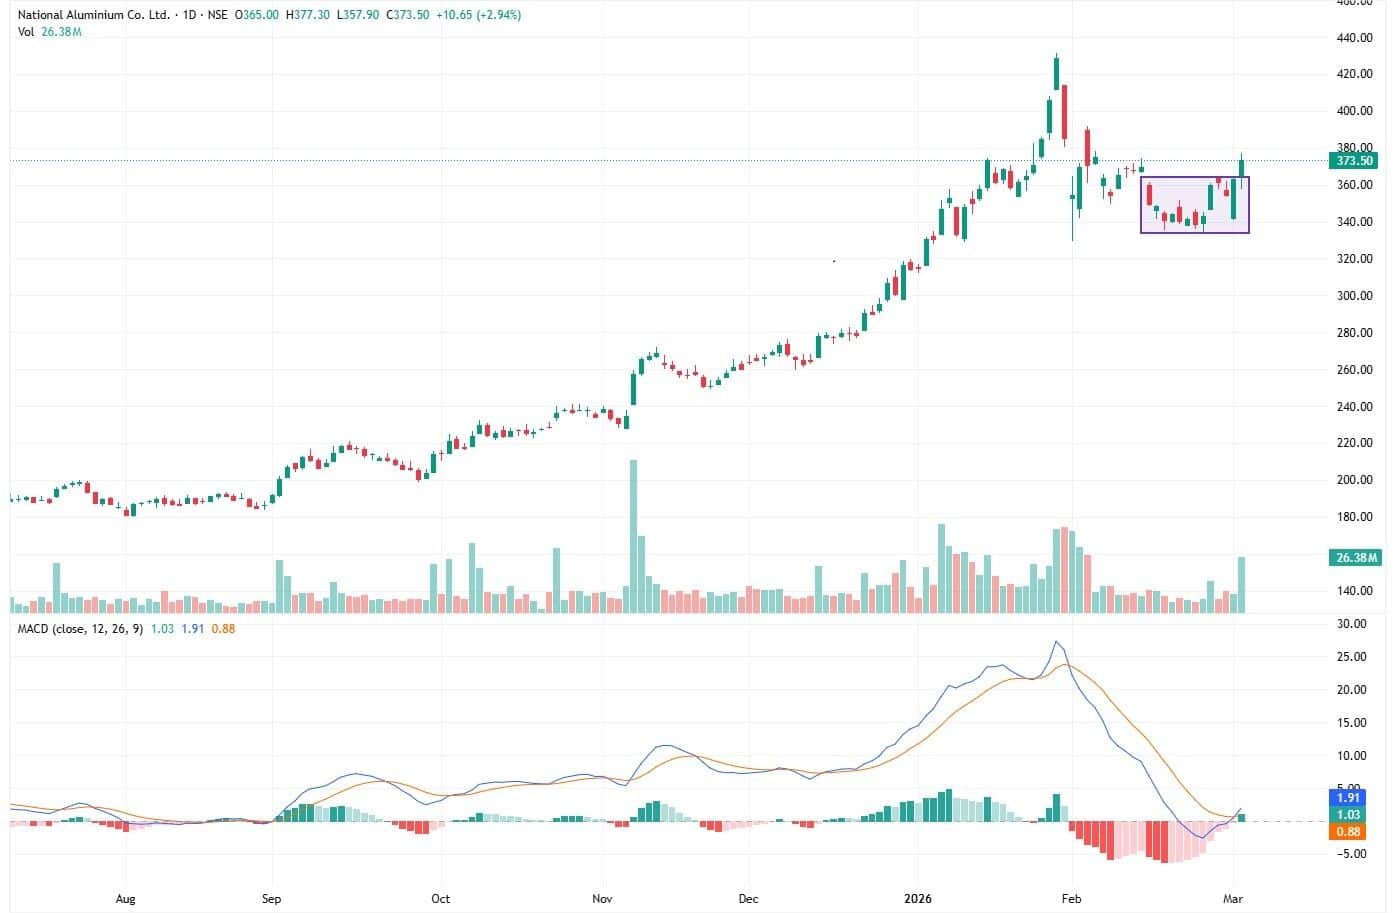
On the daily chart, NALCO had been consolidating within a narrow range of Rs 334–364 over the past three weeks, indicating a phase of accumulation. In the previous session, the stock surged nearly 3 percent and delivered a breakout above the range, closing at Rs 373.5, which signals emerging bullish strength.
Additionally, the MACD (Moving Average Convergence Divergence) indicator has given a bullish crossover, with the MACD line moving above the signal line, further supporting the positive outlook.
For now, a break above Rs 378 could trigger a further upside move towards Rs 415 or higher, while the nearest support is placed around Rs 360.
Strategy: Buy
Target: Rs 415
Stop-Loss: Rs 360
Nilesh Jain, VP- Head of Technical and Derivative research at Centrum Finverse
Coal India | CMP: Rs 435.15
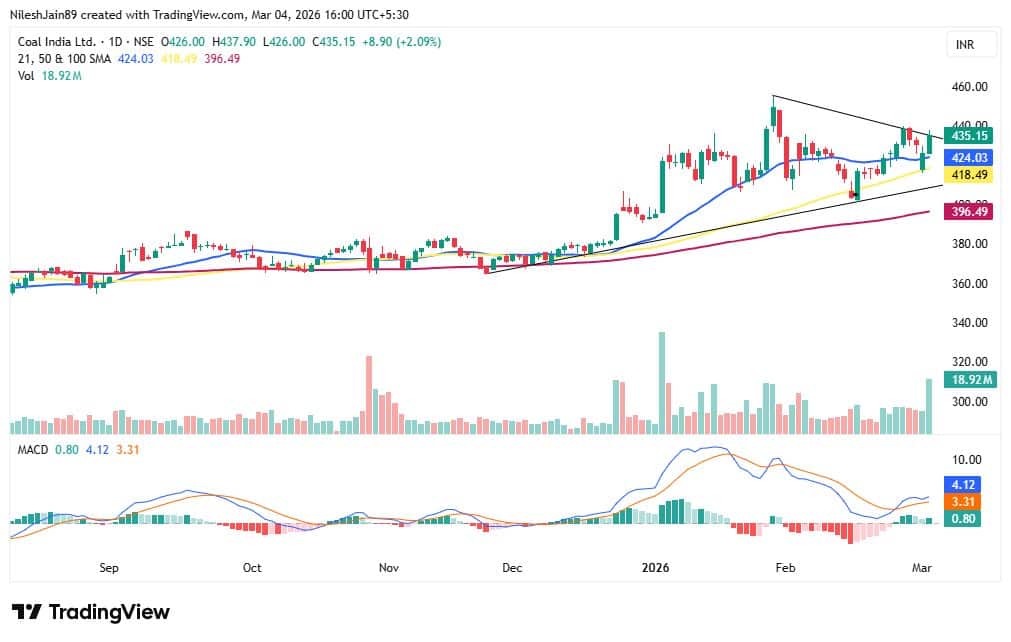
Coal India is showing strong bullish momentum and is on the verge of a fresh breakout from a falling trendline. It is firmly sustaining above all key short-term and long-term moving averages, highlighting the strength of the ongoing uptrend.
Momentum indicators and oscillators continue to remain in buy mode, while sustained long build-up in derivatives further validates the positive bias. Overall, the technical setup remains constructive, and the stock is well placed to extend its rally towards the 52-week high near Rs 460. On the downside, immediate support is seen around the 50-DMA, placed near Rs 419.
Strategy: Buy
Target: Rs 460
Stop-Loss: Rs 419
Bharat Heavy Electricals | CMP: Rs 247.9
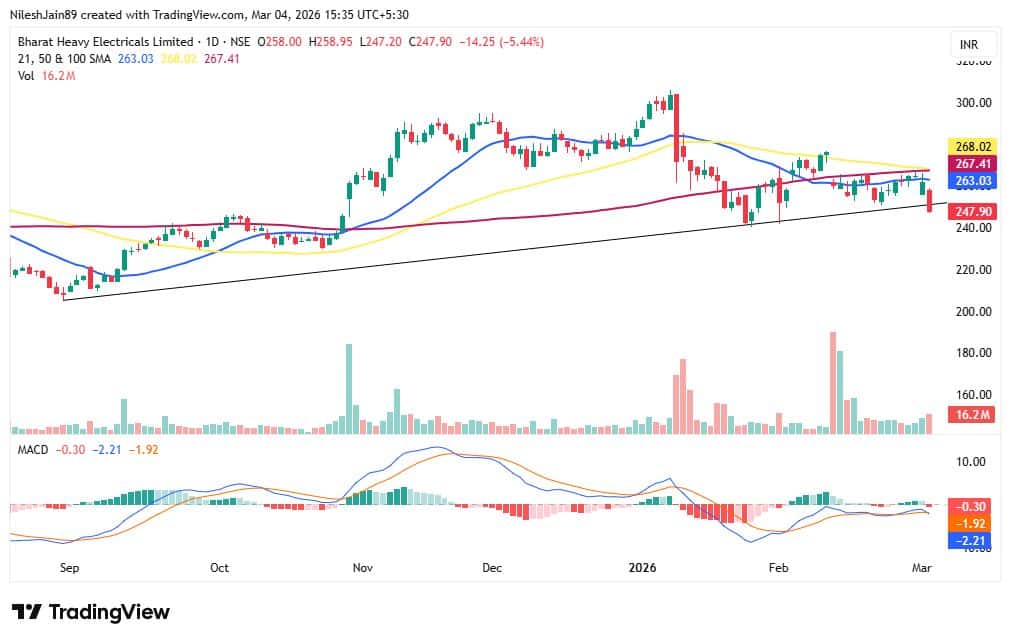
BHEL has witnessed persistent selling pressure at higher levels and has broken down below its 200-DMA, placed near Rs 252. The decline was accompanied by above-average volumes, reinforcing the bearish undertone. Momentum indicators also reflect weakness, with the RSI falling below 40 and the MACD generating a fresh sell crossover below the zero line on the daily chart.
On the derivatives front, a short build-up further supports the negative outlook. Overall, the technical setup suggests short-term weakness, and the stock may drift towards the Rs 228 level.
Strategy: Sell
Target: Rs 228
Stop-Loss: Rs 260
Sudeep Shah, Head of Technical and Derivatives Research at SBI Securities
JB Chemicals and Pharmaceuticals | CMP: Rs 2,051.8
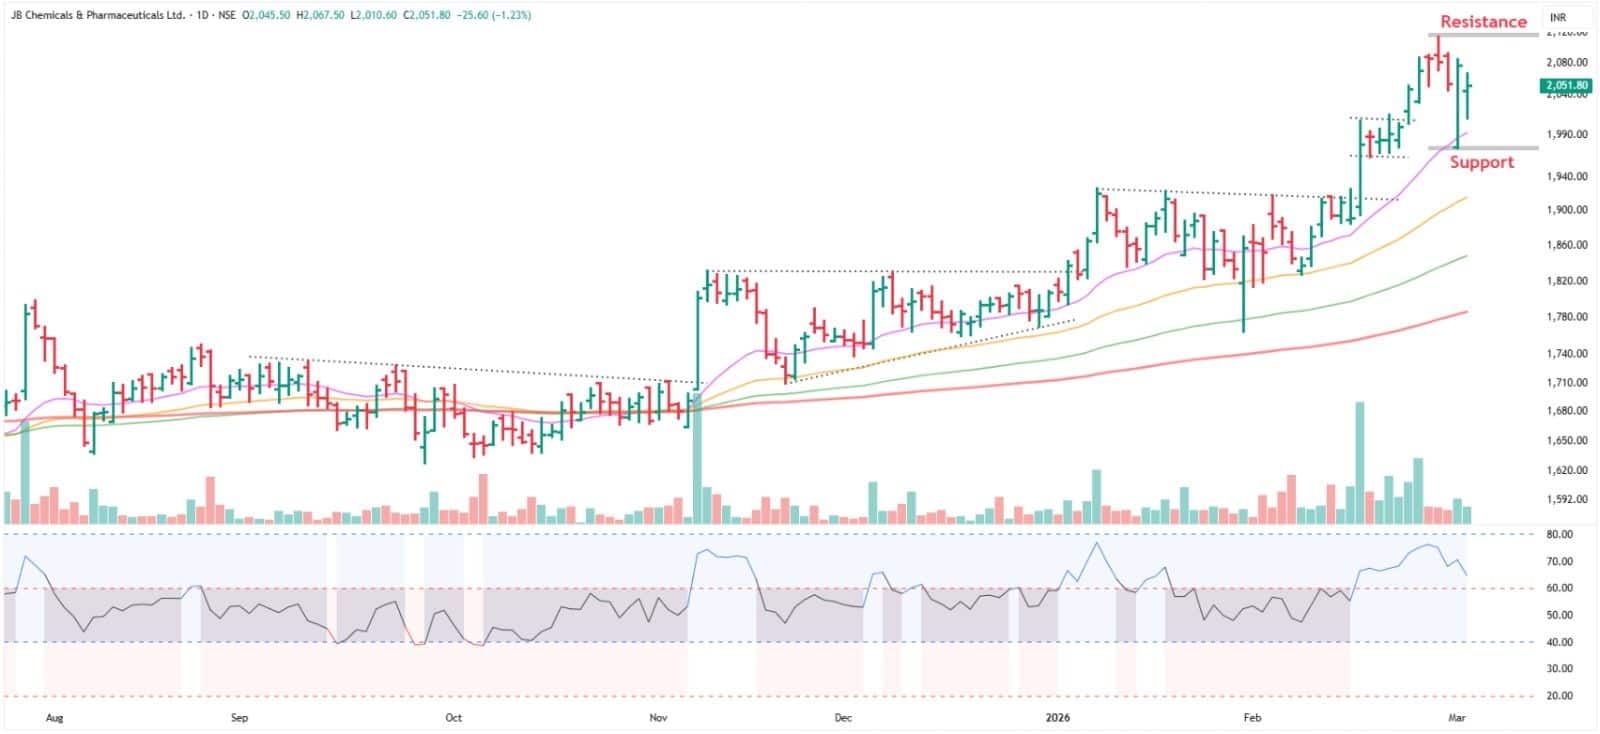
JB Chemicals gave a flag-and-pole breakout on February 23 on the daily chart. After an initial follow-through, the stock briefly erased gains and successfully retested the 20-day EMA and the breakout zone before resuming its upward move. A rising ADX signals strengthening trend momentum, while DI+ positioned above DI- highlights clear buyer dominance.
The stock is also outperforming its benchmark, Nifty Pharma, as indicated by the rising ratio line in its ratio chart relative to Nifty Pharma. Overall, the technical structure suggests the stock is well placed to extend its upward trajectory. Hence, we recommend accumulating the stock in the Rs 2,055–2,045 zone with a stop-loss at Rs 1,980. On the upside, it is likely to test the Rs 2,205 level in the short term.
Strategy: Buy
Target: Rs 2,205
Stop-Loss: Rs 1,980
REC | CMP: Rs 328.75
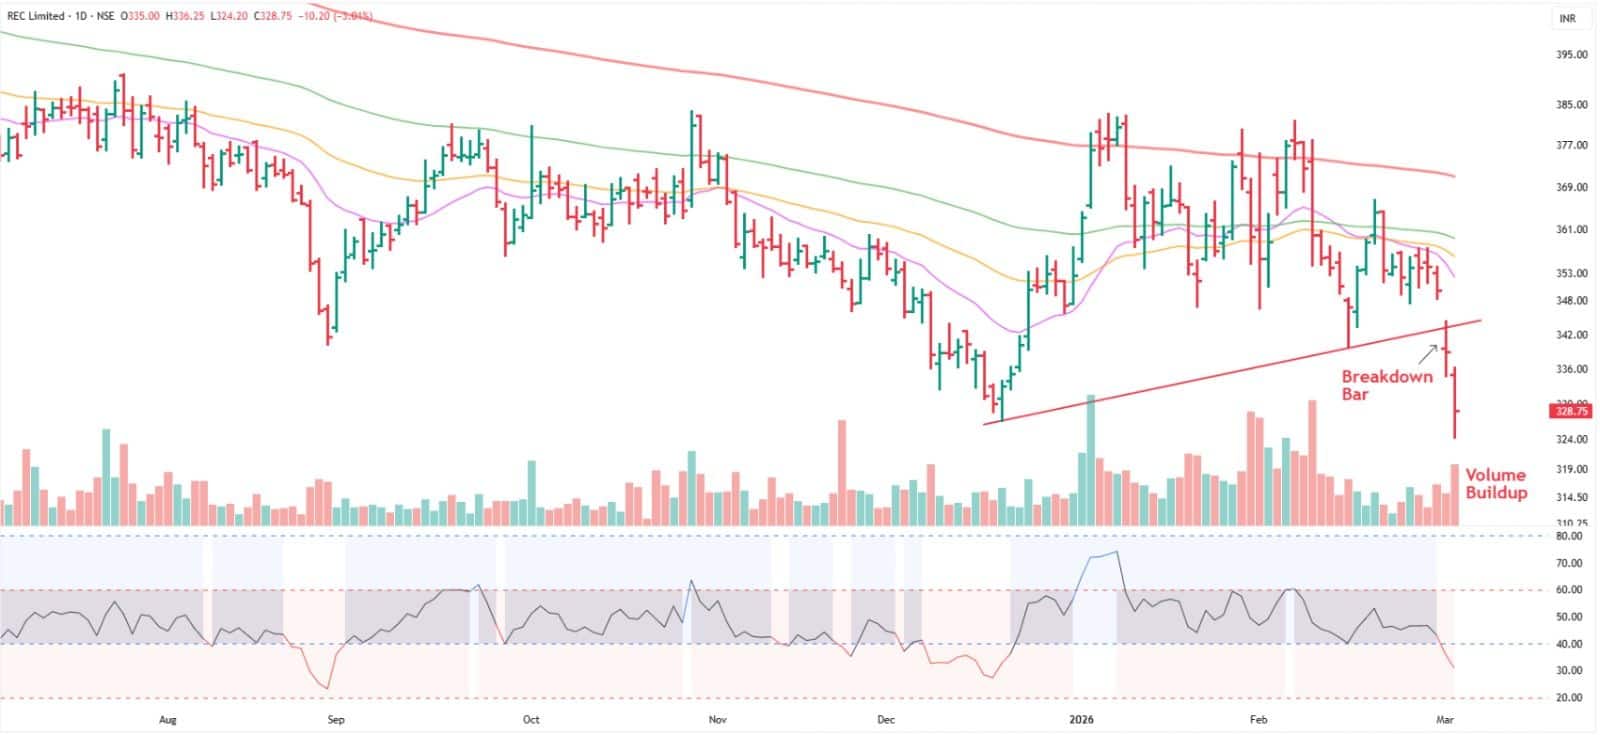
REC was consolidating in the Rs 348–358 range on the daily chart before witnessing a breakdown, followed by a strong downside follow-through. With Wednesday’s close, the stock has slipped below its prior swing low of Rs 333, reinforcing the bearish structure.
The RSI is trending lower, indicating weakening momentum, while the MACD line remains below both the zero line and the signal line. Additionally, the stock is trading well below its key short-term and long-term moving averages, suggesting the prevailing trend remains firmly negative.
Hence, we recommend selling the stock in the Rs 327–331 zone with a stop-loss at Rs 342. On the downside, it is likely to test the Rs 300 level in the short term.
Strategy: Sell
Target: Rs 300
Stop-Loss: Rs 342
Disclaimer: The views and investment tips expressed by experts on Moneycontrol are their own and not those of the website or its management. Moneycontrol advises users to check with certified experts before taking any investment decisions.Discover the latest Business News, Sensex, and Nifty updates. Obtain Personal Finance insights, tax queries, and expert opinions on Moneycontrol or download the Moneycontrol App to stay updated!
Find the best of Al News in one place, specially curated for you every weekend.
Stay on top of the latest tech trends and biggest startup news.


