


Positive global cues and lower volatility lifted the market by a percent on August 9. The market breadth was positive, with about 1,442 shares advancing against 910 declining shares on the NSE. According to experts, the Nifty 50 needs to break its consolidation by decisively climbing above 24,400, which could open the doors for 24,700, while 24,100-24,000 is expected to be a key support zone. Here are some trading ideas for the near term:
Rajesh Bhosale, Technical Analyst at Angel One
Patanjali Foods | CMP: Rs 1,800.5

On the weekly chart, Patanjali Foods has previously faced notable resistance near the Rs 1,700 level. Despite challenging market conditions last week, the stock experienced a significant breakout, confirming a bullish Saucer formation. This breakout has pushed the prices into new territory, reflecting inherent strength. Throughout the week, the stock showed a bullish gap and strong positive candles, reinforcing the breakout's validity. We recommend buying Patanjali Foods around Rs 1,800 - 1,790.
Strategy: Buy
Target: Rs 1,956
Stop-Loss: Rs 1,711
MCX India | CMP: Rs 4,378

Multi Commodity Exchange of India has consistently outperformed, maintaining a 'Higher Top Higher Bottom' price pattern. It shows minimal reaction during broader market corrections but outperforms when the market trends upward. Last week, after an initial period of consolidation, the stock experienced strong momentum on Friday, confirming a continuation Flag breakout. On a higher time frame, prices have already exceeded the key resistance level of the previous swing high of Rs 4,270 set in April 2024, indicating an overall bullish trend. Additionally, recent surges in volume during upward moves have supported the breakout. We recommend buying MCX around Rs 4,380 - 4,370.
Strategy: Buy
Target: Rs 4,680
Stop-Loss: Rs 4,277
Affle India | CMP: Rs 1,595
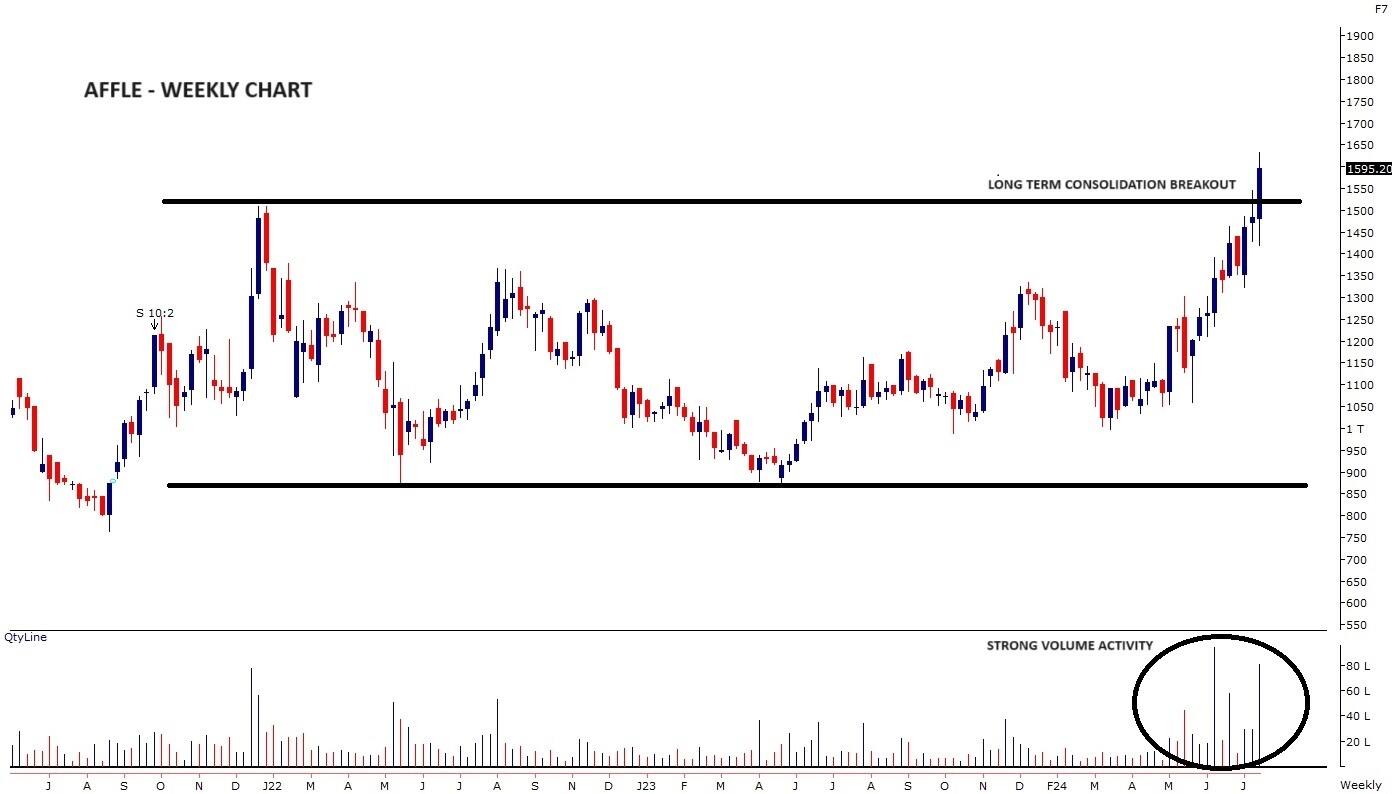
Affle India has recently demonstrated positive momentum, with any minor dips toward the 20 EMA (Exponential Moving Average) being quickly bought up. The recent upward movement has allowed the stock to surpass its January 2022 swing high, signaling a long-term breakout. Volume activity has significantly increased over the past few months, suggesting strong interest from major investors. We anticipate that this outperformance will persist. We recommend buying Affle India around Rs 1,595 - 1,585.
Strategy: Buy
Target: Rs 1,740
Stop-Loss: Rs 1,490
Nandish Shah, Senior Technical Research Analyst at HDFC Securities
MPS | CMP: Rs 2,196

MPS has broken out on the weekly chart to close at all-time high levels. The price rise is accompanied by a surge in volumes, suggesting strength in the uptrend. Momentum indicators and oscillators like MFI (Money Flow Index) and RSI (Relative Strength Index) are sloping upwards and are placed above 60 on the daily and weekly charts, suggesting strength in the current bullish trend.
Strategy: Buy
Target: Rs 2,400, Rs 2,550
Stop-Loss: Rs 2,020
Religare Enterprises | CMP: Rs 244
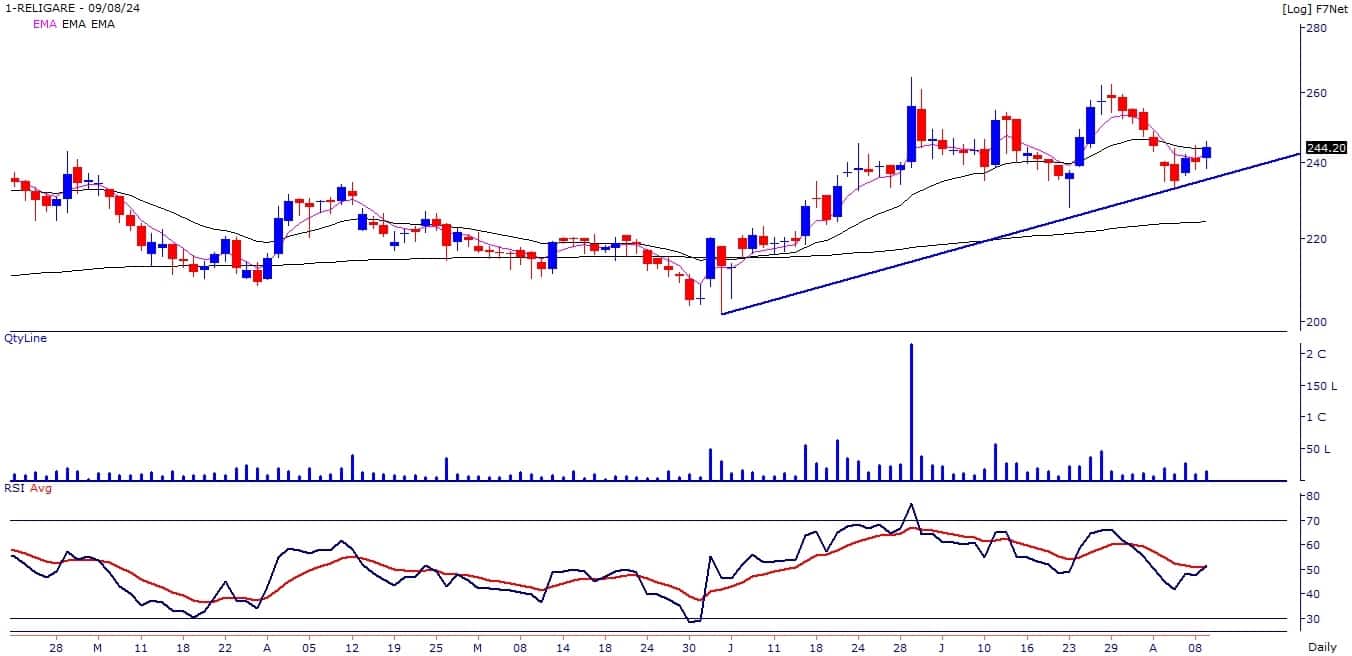
The short-term trend of Religare Enterprises has turned positive as the stock price has closed above its 5 and 11-day EMA with a rise in volumes. The primary trend of the stock is positive as the stock price is placed above its important medium and long-term moving averages.
Strategy: Buy
Target: Rs 260, Rs 275
Stop-Loss: Rs 229
KIMS | CMP: Rs 2,235

Krishna Institute of Medical Sciences (KIMS) has broken out from the last seven weeks of consolidation to close at the highest level since February 2024 with higher volumes. It has broken out from the downward sloping trendline, connecting the highs of February 29 and July 30 on the daily chart. Momentum indicators and oscillators like MFI and RSI are sloping upwards and are placed above 60 on the daily and weekly charts, suggesting strength in the current bullish trend.
Strategy: Buy
Target: Rs 2,390, Rs 2,500
Stop-Loss: Rs 2,100
Rajesh Palviya, Senior Vice President Research (Head Technical Derivatives) at Axis Securities
Sun TV Network | CMP: Rs 916.85

Sun TV Network has confirmed a "Flag" formation breakout at Rs 898 levels, accompanied by significant volume, indicating the continuation of the prior uptrend. The stock is well placed above its 20-, 50-, 100-, and 200-day SMAs, and these averages are also inching up along with the price rise, reaffirming the bullish trend. The daily, weekly, and monthly strength indicators (RSI) are in positive terrain, which justifies rising strength across all time frames. Investors should buy, hold, and accumulate this stock with an expected upside of Rs 945-985 and with a downside support zone of Rs 885-864.
Strategy: Buy
Target: Rs 945, Rs 985
Stop-Loss: Rs 885
Dr Reddy's Laboratories | CMP: Rs 7,014

Dr Reddy's Labs is in a strong uptrend across all time frames, forming a series of higher tops and bottoms, indicating a positive bias. It has also registered an all-time high at Rs 7,035 levels, representing bullish sentiment. The stock is well placed above its 20-, 50-, 100-, and 200-day SMAs, and these averages are also inching up along with the price rise, reaffirming the bullish trend. The daily, weekly, and monthly strength indicators (RSI) are in positive terrain, justifying rising strength across all time frames. Investors should buy, hold, and accumulate this stock with an expected upside of Rs 7,100-7,350, with a downside support zone of Rs 6,820-6,735.
Strategy: Buy
Target: Rs 7,100-7,350
Stop-Loss: Rs 6,820
Jigar S Patel, Senior Manager - Equity Research at Anand Rathi
FSN E-Commerce Ventures | CMP: Rs 192
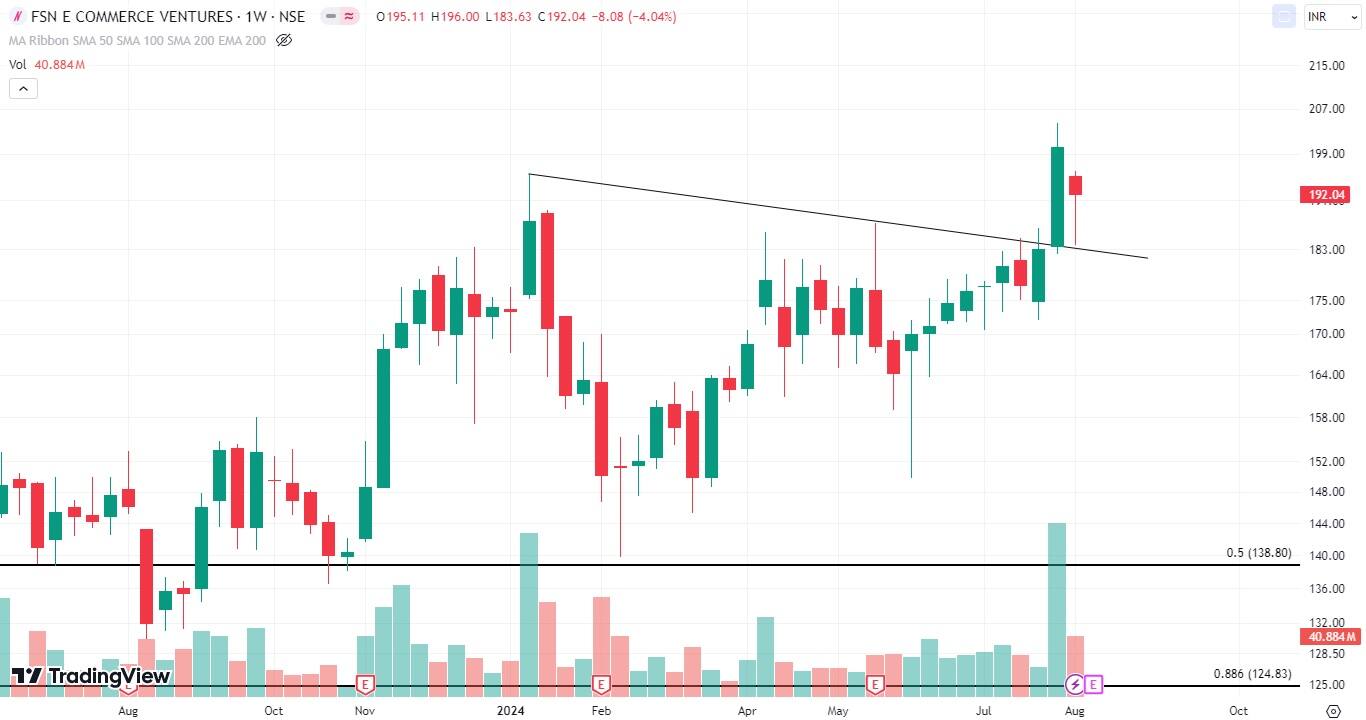
After a brief period of consolidation around its 21- and 50-day Exponential Moving Averages (DEMA), Nykaa has successfully surpassed its previous high of approximately Rs 184. This consolidation phase indicates the formation of a robust base, setting the stage for further upward movement. From a technical analysis perspective, the daily Relative Strength Index (RSI) has rebounded from the 50 level, signaling a potential increase in bullish momentum over the coming sessions. Based on these observations, it is recommended to buy Nykaa within the price range of Rs 190-195. The anticipated upside target is Rs 220, with a stop-loss set at Rs 178 based on a daily closing price to safeguard against potential downside risks.
Strategy: Buy
Target: Rs 220
Stop-Loss: Rs 178
SBI Cards and Payment Services | CMP: Rs 710

Following a peak near Rs 933, SBI Card and Payment Services experienced a significant downturn, with a sharp decline of nearly Rs 280, representing a substantial decrease of approximately 30% in its overall value. Despite this steep drop, SBI Card has managed to stabilize around the Rs 675 level over the past week, forming a sustained support base. This stabilization is a critical sign of potential recovery. Notably, during this period, a bullish alternate pattern has emerged near the Rs 680-710 level, further confirming positive market sentiment. This pattern indicates that the market may be shifting from a bearish to a bullish phase, suggesting a potential rebound.
Moreover, the analysis of the daily RSI reveals a bullish divergence, a strong technical indicator signaling a favourable outlook for the stock. A bullish divergence occurs when the stock price hits a new low while the RSI hits a higher low, indicating that the selling momentum is weakening. Considering these positive technical indicators and chart patterns, investors might find it prudent to initiate buy positions within the range of Rs 705 to Rs 715. The upside objective for this strategy is targeted at Rs 800, suggesting potential gains as the stock price recovers. To manage risk effectively, a stop-loss order should be set at Rs 665 on a daily closing basis.
Strategy: Buy
Target: Rs 800
Stop-Loss: Rs 665
Disclaimer: The views and investment tips expressed by investment experts on Moneycontrol.com are their own and not those of the website or its management. Moneycontrol.com advises users to check with certified experts before taking any investment decisions.
Discover the latest Business News, Sensex, and Nifty updates. Obtain Personal Finance insights, tax queries, and expert opinions on Moneycontrol or download the Moneycontrol App to stay updated!
Find the best of Al News in one place, specially curated for you every weekend.
Stay on top of the latest tech trends and biggest startup news.


