


The market snapped its two-day losing streak with the Nifty 50 rising 0.4% to close just above the 200-day EMA (Exponential Moving Average of 23,700) on January 7, partly due to short-covering and value buying. However, overall sentiment remains bearish, and the index may continue to consolidate until it moves above all key moving averages. In the near term, it may trade within the 23,500–24,000 range. If the index manages to sustain above 23,700, the immediate resistance is at 23,900–24,000. However, if it falls below this level, 23,500 is the key level to watch, as it coincides with an upward-sloping support trendline, experts said.

Here are 15 data points we have collated to help you spot profitable trades:
1) Key Levels For The Nifty 50 (23,708)
Resistance based on pivot points: 23,774, 23,811, and 23,871
Support based on pivot points: 23,654, 23,616, and 23,556
Special Formation: The Nifty 50 has formed an Inside Bar candlestick pattern on the daily charts with above-average volumes, while defending the previous day’s low of 23,552. The index remained near the lower band of the Bollinger Bands, trading below the 10, 20, 50, and 100-day EMAs, though it closed just above the 200-day EMA. The momentum indicators, RSI (Relative Strength Index at 43), remain in the lower band, and MACD (Moving Average Convergence Divergence) remains below the zero line, indicating weakness.
2) Key Levels For The Bank Nifty (50,202)
Resistance based on pivot points: 50,389, 50,502, and 50,685
Support based on pivot points: 50,024, 49,911, and 49,728
Resistance based on Fibonacci retracement: 50,730, 51,332
Support based on Fibonacci retracement: 49,289, 47,862
Special Formation: The Bank Nifty has also formed an Inside Bar candlestick pattern on the daily timeframe but remains below all key moving averages, including the 200-day EMA (of 50,490), signaling a negative trend. The index is positioned near the lower end of the Bollinger Bands, while the RSI (at 37.3) remains in the lower band and the MACD is below the zero line, further signaling weakness.

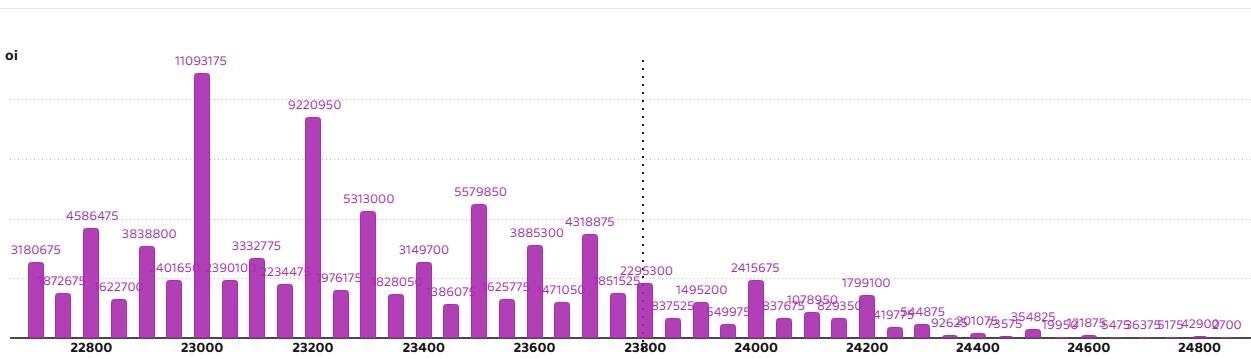
According to the weekly options data, the 24,500 strike holds the maximum Call open interest (with 1.28 crore contracts). This level can act as a key resistance for the Nifty in the short term. It was followed by the 24,000 strike (1.2 crore contracts) and the 24,200 strike (1.1 crore contracts).
Maximum Call writing was observed at the 24,000 strike, which saw an addition of 30.07 lakh contracts, followed by the 24,400 and 23,800 strikes, which added 20.02 lakh and 19.6 lakh contracts, respectively. The maximum Call unwinding was seen at the 23,600 strike, which shed 7.05 lakh contracts, followed by the 24,800 and 24,550 strikes, which shed 6.97 lakh and 6.71 lakh contracts, respectively.

On the Put side, the maximum Put open interest was seen at the 23,000 strike (with 1.1 crore contracts), which can act as a key support level for the Nifty. It was followed by the 23,200 strike (92.2 lakh contracts) and the 23,500 strike (55.79 lakh contracts).
The maximum Put writing was placed at the 23,200 strike, which saw an addition of 62.91 lakh contracts, followed by the 23,000 and 23,700 strikes, which added 25.83 lakh and 19.64 lakh contracts, respectively. The maximum Put unwinding was seen at the 24,000 strike, which shed 3.15 lakh contracts, followed by the 24,150 and 24,100 strikes, which shed 2.48 lakh and 2.12 lakh contracts, respectively.
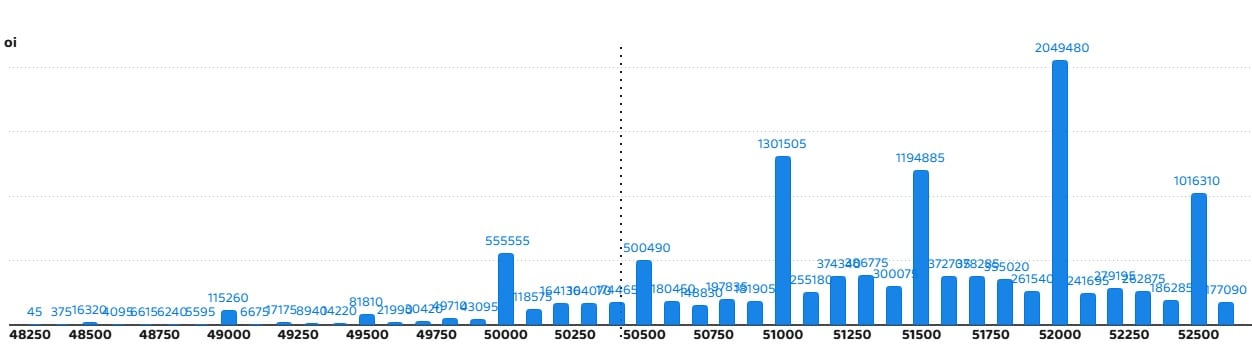
5) Bank Nifty Call Options Data
According to the monthly options data, the 52,000 strike holds the maximum Call open interest, with 20.49 lakh contracts. This can act as a key resistance level for the index in the short term. It was followed by the 51,000 strike (13.01 lakh contracts) and the 51,500 strike (11.94 lakh contracts).
Maximum Call writing was visible at the 50,400 strike (with the addition of 34,170 contracts), followed by the 50,300 strike (31,830 contracts) and the 52,300 strike (25,785 contracts). The maximum Call unwinding was seen at the 52,000 strike, which shed 1.1 lakh contracts, followed by the 50,000 and 52,500 strikes, which shed 91,635 and 81,930 contracts, respectively.
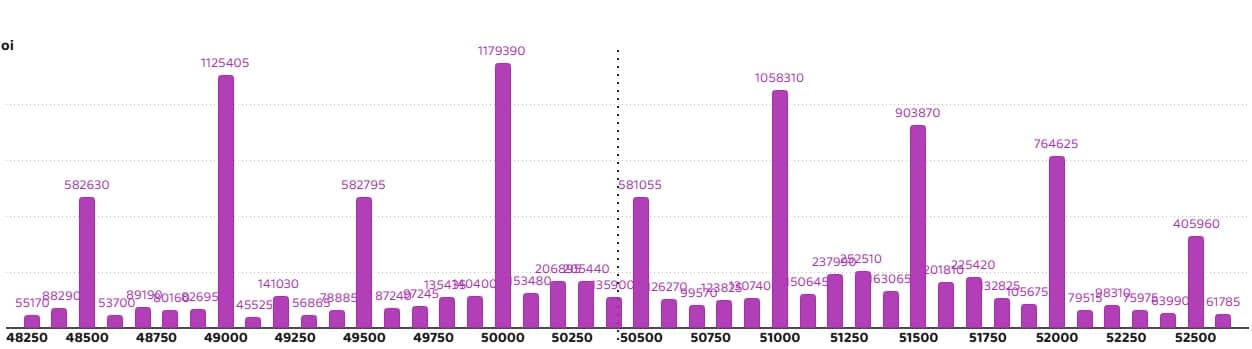
6) Bank Nifty Put Options Data
On the Put side, the maximum Put open interest was seen at the 50,000 strike (with 11.79 lakh contracts), which can act as a key support level for the index. This was followed by the 49,000 strike (11.25 lakh contracts) and the 51,000 strike (10.58 lakh contracts).
The maximum Put writing was observed at the 50,300 strike (which added 90,045 contracts), followed by the 49,500 strike (32,880 contracts) and the 50,000 strike (23,850 contracts). The maximum Put unwinding was seen at the 48,500 strike, which shed 1.28 lakh contracts, followed by the 50,500 and 49,000 strikes which shed 1.13 lakh and 72,330 contracts, respectively.
7) Funds Flow (Rs crore)

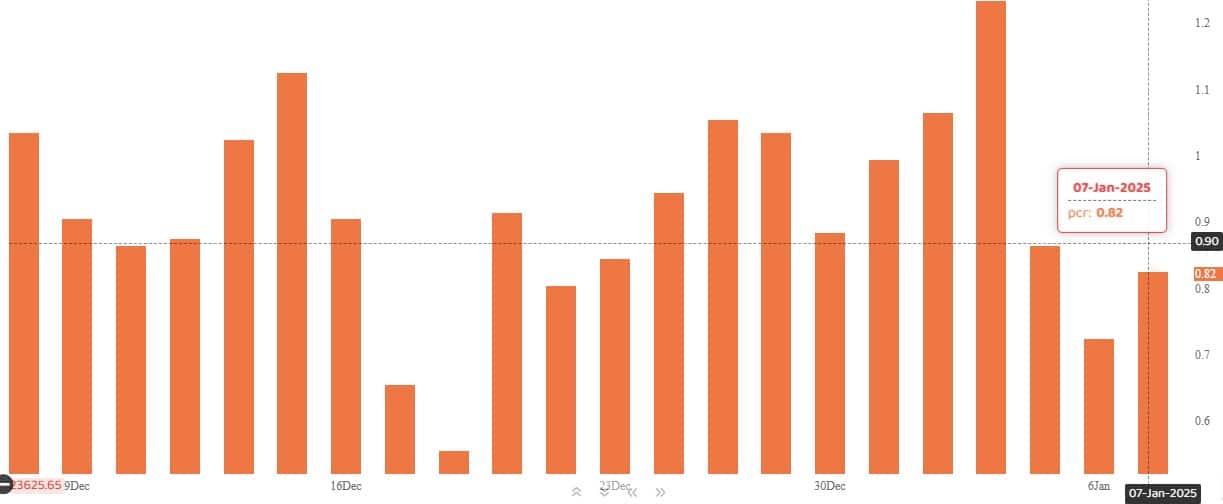
The Nifty Put-Call ratio (PCR), which indicates the mood of the market, rose to 0.82 on January 7, from 0.72 level in the previous session.
The increasing PCR, or being higher than 0.7 or surpassing 1, means traders are selling more Put options than Call options, which generally indicates the firming up of a bullish sentiment in the market. If the ratio falls below 0.7 or moves towards 0.5, then it indicates selling in Calls is higher than selling in Puts, reflecting a bearish mood in the market.
9) India VIX
The India VIX, the fear gauge that measures market volatility, declined by 6.33% to 14.66, after a 15.58% surge in the previous session. The index is still above the 14 level, signaling caution for bulls.

A long build-up was seen in 83 stocks. An increase in open interest (OI) and price indicates a build-up of long positions.

11) Long Unwinding (19 Stocks)
19 stocks saw a decline in open interest (OI) along with a fall in price, indicating long unwinding.
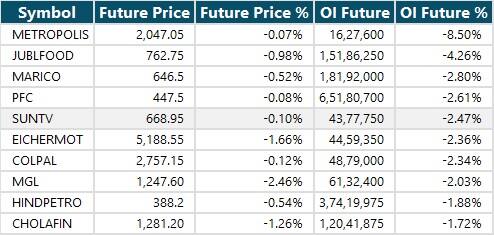
12) Short Build-up (41 Stocks)
41 stocks saw an increase in OI along with a fall in price, indicating a build-up of short positions.

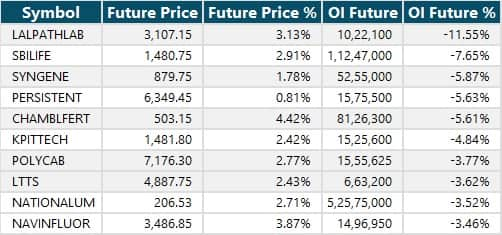
13) Short-Covering (84 Stocks)
84 stocks saw short-covering, meaning a decrease in OI, along with a price increase.
Here are the stocks that saw a high share of delivery trades. A high share of delivery reflects investing (as opposed to trading) interest in a stock.

Securities banned under the F&O segment include companies where derivative contracts cross 95 percent of the market-wide position limit.
Stocks added to F&O ban: Bandhan Bank
Stocks retained in F&O ban: Hindustan Copper, Manappuram Finance, RBL Bank
Stocks removed from F&O ban: Nil
Disclaimer: The views and investment tips expressed by experts on Moneycontrol are their own and not those of the website or its management. Moneycontrol advises users to check with certified experts before taking any investment decisions.Disclosure: Moneycontrol is a part of the Network18 group. Network18 is controlled by Independent Media Trust, of which Reliance Industries is the sole beneficiary.Discover the latest Business News, Sensex, and Nifty updates. Obtain Personal Finance insights, tax queries, and expert opinions on Moneycontrol or download the Moneycontrol App to stay updated!
Find the best of Al News in one place, specially curated for you every weekend.
Stay on top of the latest tech trends and biggest startup news.


