Moneycontrol Contributor
June 03, 2020 / 09:33 IST
Gaurav Bissa
Story continues below Advertisement
BankNifty has seen strong correction from 32,000-odd levels towards 16,000-17,000 levels in the last few months. The sector has been constantly under pressure and was the prominent reason for Nifty50 failing to scale higher levels.
After a strong jump in the last few days, it has raised hopes of bulls.
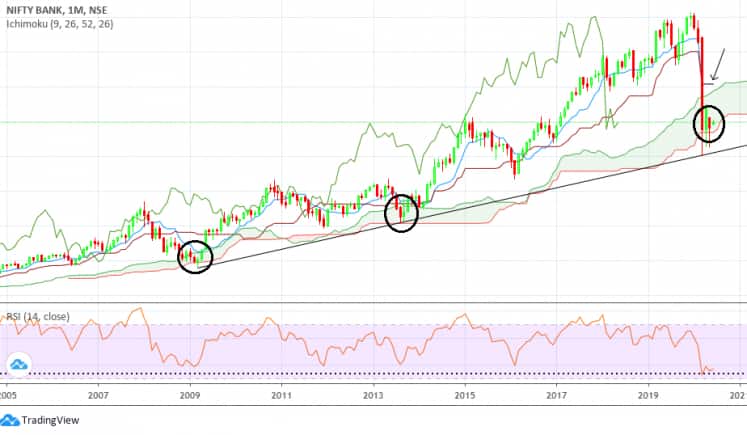
On the monthly chart, the index has bounced every time it has entered in ‘Ichimoku’ cloud area. It first entered cloud area in 2008-2009 after which it witnessed a fresh high life-level.
The second instance was in 2013, which again saw a fresh life high levels being made in the coming months. This is the third time it has entered the cloud area.
Though it went below the cloud area it managed to close inside it which can be taken as a positive sign. Thus as long as it doesn’t give a close below cloud area which is 18,600 there will be an opportunity of a rise in the index.
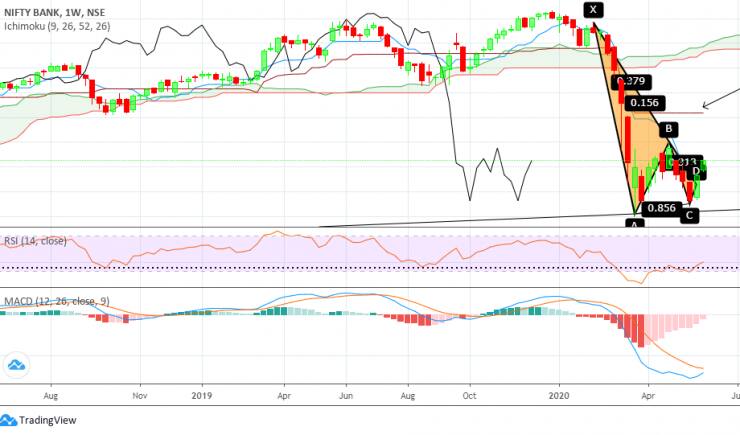
On the weekly charts, the index has formed a ‘C clamp’ which generally works on the principle similar to overbought/oversold zones but based on Ichimoku studies. This pattern reflects the possibility of the index touching 23000-24000 levels in the coming weeks.
The index has also formed a bullish dragon harmonic pattern which is a reversal pattern in nature. In addition, it can also be called a pattern which has a tendency to culminate in a completed harmonic bat pattern. Thus the targets for dragon patterns are significantly higher with the possibility of attempting previous high levels.
Story continues below Advertisement
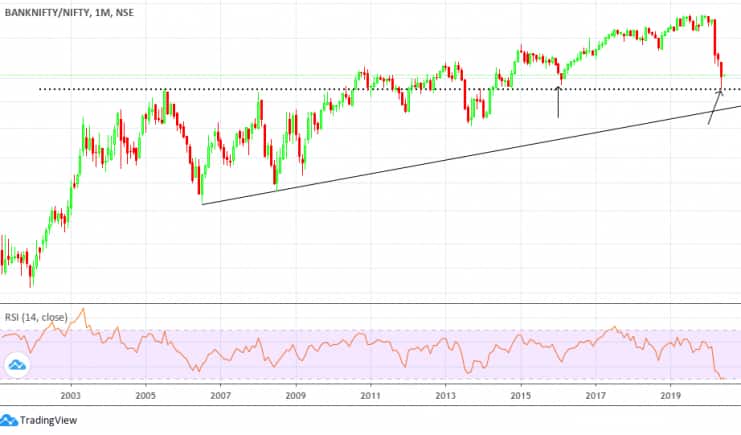
If we refer to the table above, it is an interesting concept. It takes into account the relative strength of BankNifty as compared to Nifty. As you can see in the above chart, the ratio (banknifty/nifty) has been plunging which implies that BankNifty has been underperforming nifty.However, the ratio has now taken bounce from medium-term support as shown by a horizontal line. This reflects the possibility of the ratio inching higher which means that banknifty can outperform nifty in the coming weeks.
(The author is AVP-Technicals and Derivatives at LKP Securities)
Disclaimer: The views and investment tips expressed by investment experts on Moneycontrol.com are their own and not that of the website or its management. Moneycontrol.com advises users to check with certified experts before taking any investment decisions.
Discover the latest Business News, Sensex, and Nifty updates. Obtain Personal Finance insights, tax queries, and expert opinions on Moneycontrol or download the Moneycontrol App to stay updated!