


During the week ended April 26, the market, particularly the Nifty 50, showed rangebound behaviour despite an initial gap-up opening on Monday. Throughout the week, it struggled to break free from this consolidation pattern, eventually closing with modest gains of approximately 1.23 percent. Despite attempts to breach the resistance at 22,600, the Nifty failed to sustain above it, and a sharp downturn in the final session led to the erosion of most of its gains.
From a technical standpoint, the Nifty is trading within a rising channel pattern, suggesting potential bullish momentum if it manages to maintain levels above 22,300 in the current week, with a likely target range of 22,750-22,800.
Additionally, the long-short ratio of foreign institutional investors (FIIs) stands at 39 percent, indicating limited downside potential.
Looking forward, immediate resistance levels for the Nifty are projected at 22,700-22,800, and a decisive close above this range could trigger renewed buying interest in the index futures. Conversely, a breach of the support at 22,300 might intensify the selling pressure in the markets.
As for the Nifty Bank index, it experienced a notable uptrend, rallying approximately 2,000 points from the low of 46,600 levels and ending the week with gains of about 1.32 percent. However, the breakout from the cup-and-handle pattern faced significant resistance in the 48,600-48,700 zone, notably near the previous top recorded on December 28, 2023 at 48,636.
Surpassing the 49,000 level appears challenging for the Nifty Bank, with support seen at 47,700; a breach of this level could potentially trigger further selling in the index.
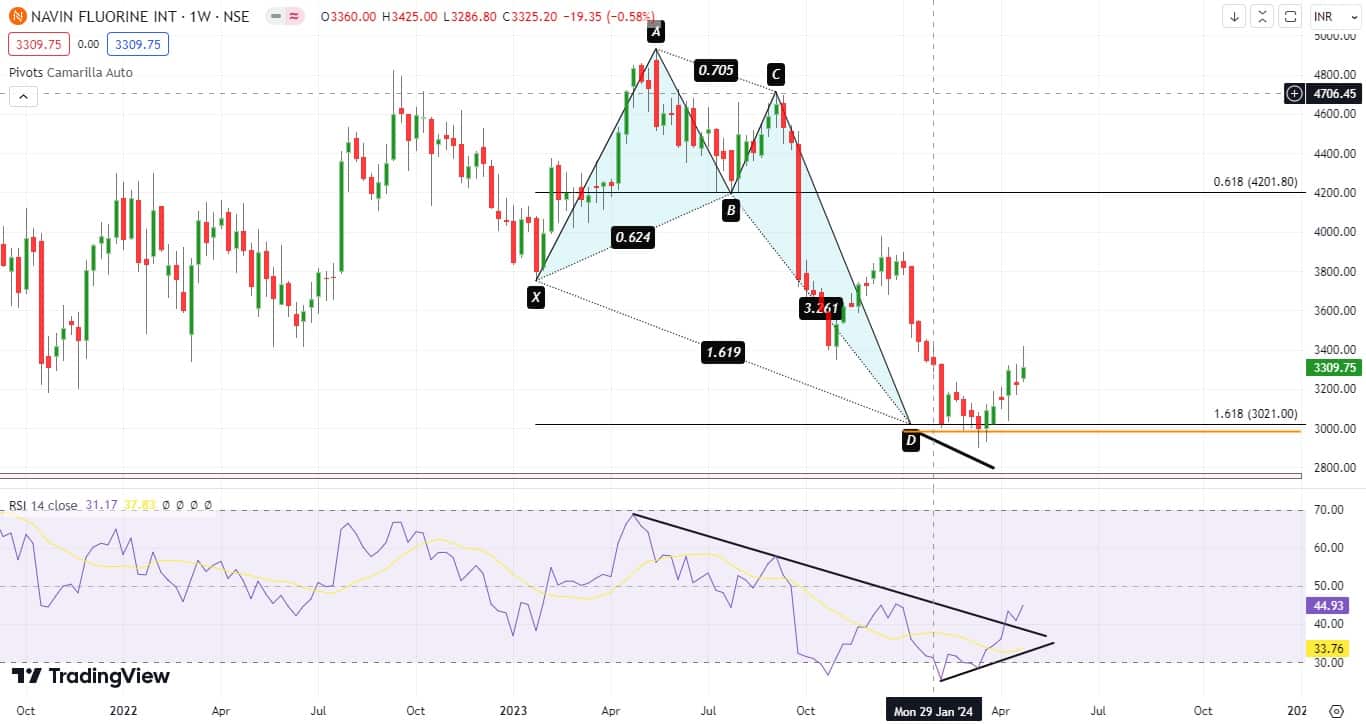
Here are three buy calls for the next 2-3 weeks:Navin Fluorine International: Buy | LTP: Rs 3,310 | Stop-Loss: Rs 3,095 | Target: Rs 3,700 | Return: 12 percent
Following its Double Top formation near the Rs 4,900-4,800 zone, Navin Fluorine has experienced a significant downturn, shedding 41 percent in price. However, in the last 5-6 trading sessions, it has found support near Rs 3,000 mark.
Concurrently, a Bullish Crab pattern has materialized on Navin Fluorine's daily chart, signaling a potential reversal in trend. Moreover, "regular bull divergence"* has been identified on the relative strength index (RSI) daily scale, indicating strengthening bullish momentum.
Based on these technical indicators, investors may consider initiating long positions within the range of Rs 3,270-3,320. The upside target for this trade is set at Rs 3,700. To manage risk, a stop-loss order should be placed near Rs 3,095, helping to limit potential losses in case the trade doesn't perform as expected.
NOTE: If the price is making lower lows, but the oscillator is making higher lows, this is considered to be regular bullish divergence.
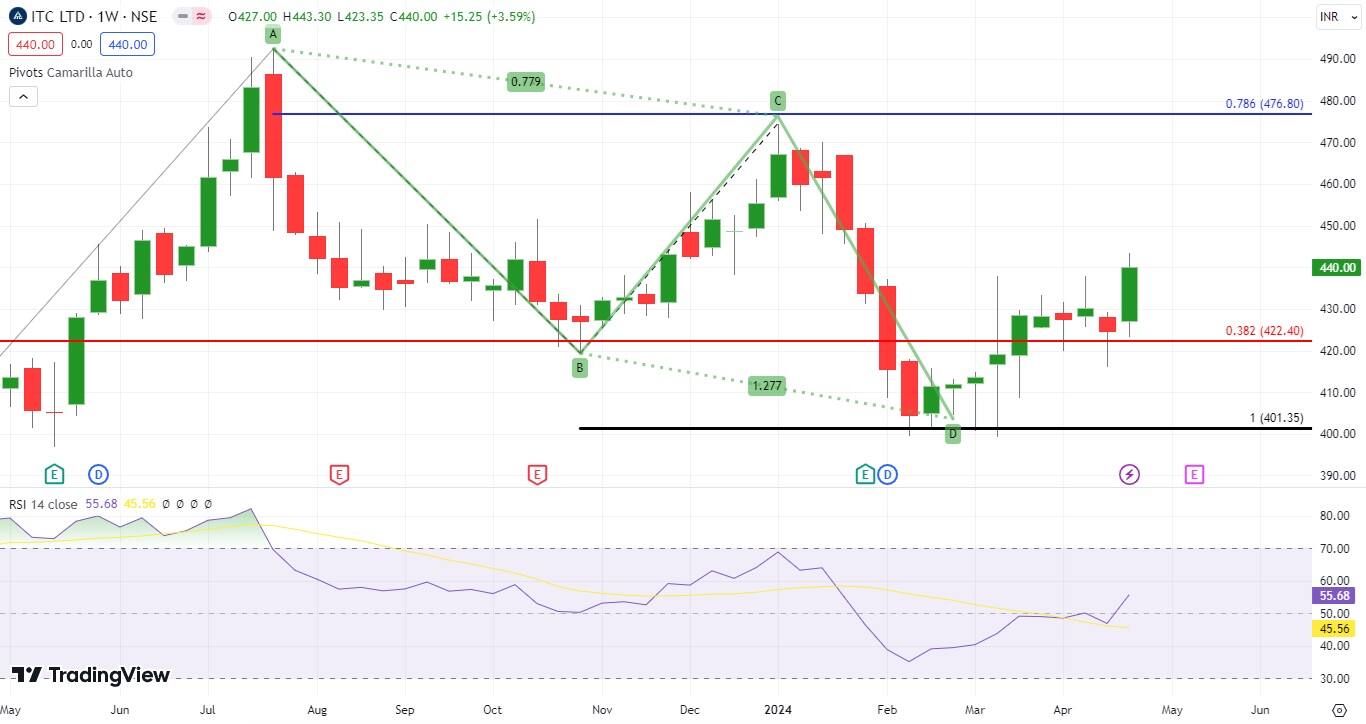
ITC: Buy | LTP: Rs 440 | Stop-Loss: Rs 412 | Target: Rs 480 | Return: 9 percent
After reaching a peak near Rs 475 mark on January 4, 2024, ITC has experienced a significant decline of approximately 16 percent. However, in the subsequent 18 trading sessions, ITC has shown stability by avoiding further declines and has instead consolidated within a range of Rs 400-416.
Notably, in the previous trading session, there was notable buying interest observed at lower levels, accompanied by substantial trading volume. From a technical standpoint, the formation of a bullish AB=CD pattern on the daily chart of ITC within the mentioned price zone of Rs 400-416. Interestingly, this zone also coincides with the 0.382 percent retracement level of a price swing that occurred between January 2023 and July 2023, as indicated on the chart.
Additionally, RSI weekly has reversed from 45 levels, which suggests a potentially lucrative buying opportunity.
Thus, one can buy in the zone of Rs 430-440, with an upside target of Rs 480 and a stop-loss would be placed near Rs 412 on a daily close basis.
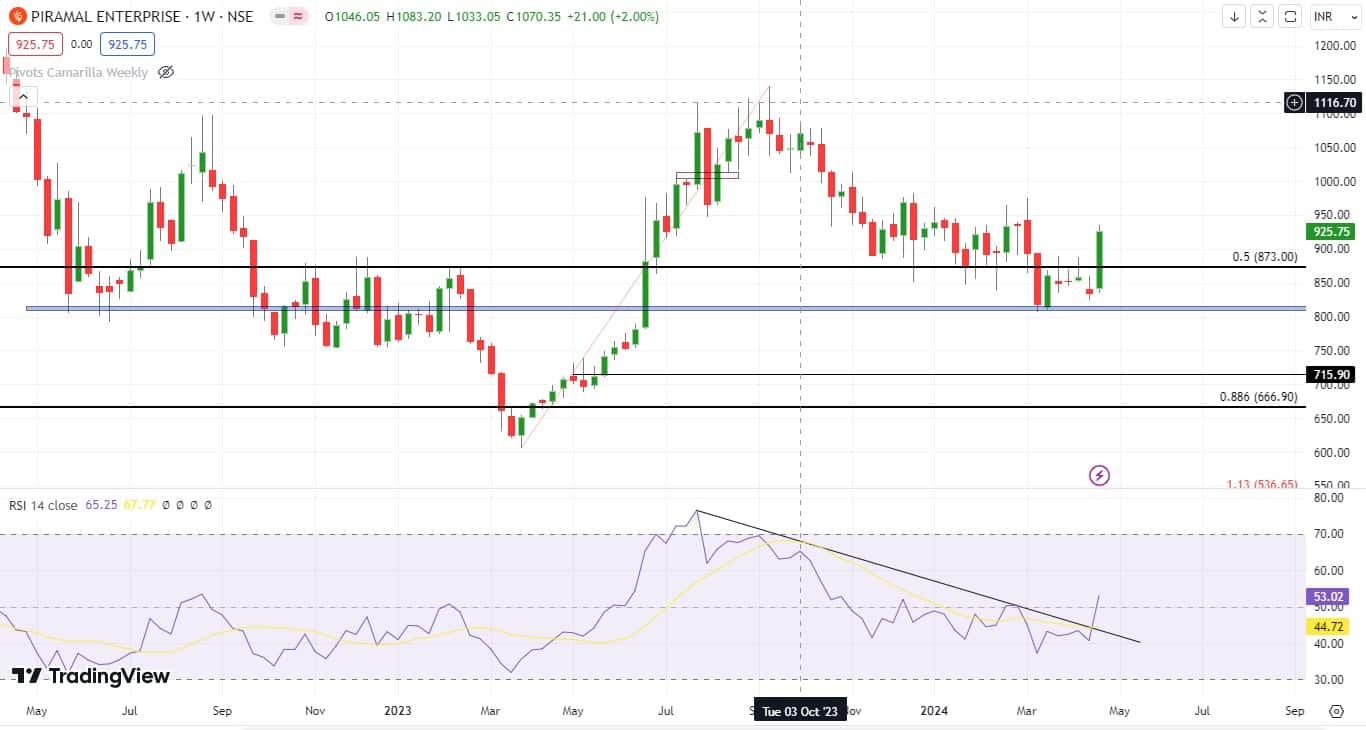
Piramal Enterprises: Buy | LTP: Rs 926 | Stop-Loss: Rs 845 | Target: Rs 1,055 | Return: 14 percent
In September 2023, PEL reached its zenith, soaring to nearly Rs 1,140. However, it subsequently endured a substantial downturn, plummeting by 29 percent. Presently, the stock seems to have discovered a level of support within the bracket of Rs 820-850, suggesting a potential stabilization in its price movement.
Notably, recent market observations have unveiled the formation of a Double Bottom pattern on the daily chart, accompanied by bear-trendline violation on weekly RSI —a promising indication for traders. This confluence of technical signals presents an enticing opportunity for market participants.
In light of these developments, traders are advised to contemplate initiating long positions within the range of Rs 900-930. The anticipated target for this bullish trade is positioned at Rs 1,055, representing a potential upside opportunity.
To manage risks effectively, it is recommended to set a stop-loss level at Rs 845, to be evaluated based on daily closing prices.

Discover the latest Business News, Sensex, and Nifty updates. Obtain Personal Finance insights, tax queries, and expert opinions on Moneycontrol or download the Moneycontrol App to stay updated!
Find the best of Al News in one place, specially curated for you every weekend.
Stay on top of the latest tech trends and biggest startup news.


