


Dominance of a few companies -or concentration - in the US stock market indices has been rising, and causing market participants to worry about a possible bubble. Active fund managers are agonising over the difficulty of beating the benchmark.
This raises a question--does concentration seem higher only in relation to earlier stock-market concentration levels, which were lower because they were mispriced, and whether the concentration is justified by the fundamentals.
Also read: MC Explains: Why does Michael Mauboussin say that share buybacks are not always good for investors
To both, the answers are in the affirmative. "Investors have to deal with the world as it is rather than how they wish it to be," says the latest note from Michael Mauboussin, Head of Consilient Research for Counterpoint Global, Morgan Stanley Investment Management, and his colleague, Dan Callahan, a member of Consilient Research.
Too low earlier?
In the Counterpoint Global Insights' latest note titled "Stock Market Concentration: How much is Too Much?", the authors noted that investors now think that concentration is too high because it has risen sharply from a much lower level.
"But perhaps we should ask whether concentration was too low before," they added.
To find an answer to this, they looked at the excess returns that large-cap stocks have delivered to their shareholders in relation to the returns delivered by the overall market.
To do this, they took the market cap of the top 1, 3 and 10 companies as of the end of 2023 and discounted them back 5 and 10 years at the market return. This was to check what the market caps would have been had the markets priced them efficiently.
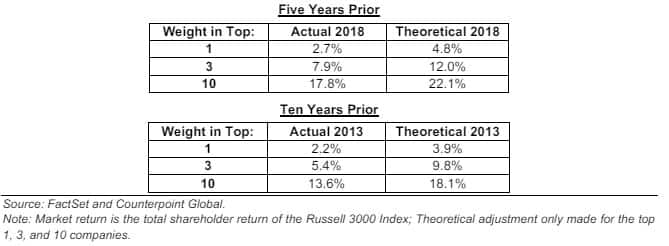 Actual versus Theoretical Market Concentration in the US Anticipating 2023 Results
They concluded that the market may have infact mispriced them in the past and that the stocks concentration may have been "too low" back then.
What about the fundamentals?
Then, they also checked the concentration against underlying fundamentals.
As the analysts wrote, "Stock market concentration may be justified if the market capitalisations mirror the value creation prospects."
To measure value creation, they looked at economic profit. Economic profit is calculated taking into account the return of invested capital (ROIC), weighted average cost of capital (WACC) and invested capital.
Its formula: Economic profit=(ROIC-WACC) x Invested Capital.
For example, the economic profit of a company that has an ROIC of 13 percent, a WACC of 8 percent, and invested capital of $1,000 would be $50. This is from (0.13 – 0.08) × $1,000 = $50.
The top 10 companies had a large share of the economic profit generated by the US public companies. This was particularly true in 2023 when the top 10 earned 69 percent of the economic profit.
 Economic Profit of Top 10 by Market Cap and of Rest of Universe, US, 2014-2023
They also found that the ROIC generated by the large-cap stocks and small-cap stocks have increased over the recent decades.
 Aggregate ROIC for Large and Small Capitalization Stocks in the U.S., 1990-2023
Tough for active fund managers
Given this, the analysts went on to review the implications of these findings on active fund managers. They acknowledged that the rising stock-market concentration does make it challenging for these managers because, on average, they own stocks with smaller market caps than those in their benchmarks.
"That means when large cap stocks do well relative to small cap stocks, the percentage of mutual funds that outperform the benchmark tends to go down," they wrote.
Also as concentration increases, the market tends to deliver better returns.
The report stated, "The market tends to produce returns above the historical average in periods when concentration is rising and returns below the average when concentration is falling." They plotted the returns as concentration rose (from trough to peak) and fell (peak to trough) through over 7 decades.
During this period S&P 500’s compound annual total shareholder return (TSR) over the full period was 11.4 percent.
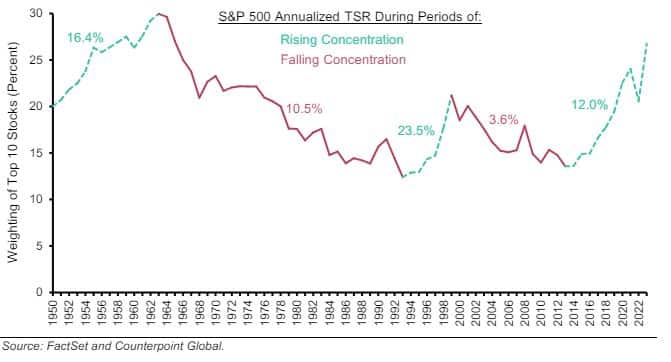 S&P 500 Annual Returns During Rising and Falling Concentration, 1950-2023
Returns of Top 3 stocks
They made two more interesting findings from the study.
Also read: Want to chat with the famed finance guru Michael Mauboussin? Here's how
One: the top stock has historically been a bad investment, and that the second and third largest stocks fared considerably better.
 Index of Annual Relative Returns for Top 1, 2 and 3 Stocks in the US, 1950-2023
Two, the top three stocks produced markedly better relative returns from the end of 2013 through 2023 than they did in the past.
In conclusion, they wrote, "Where we go from here is anyone’s guess, but assessments of sustainable competitive advantage and growth will be central to determining that path."
Discover the latest Business News, Sensex, and Nifty updates. Obtain Personal Finance insights, tax queries, and expert opinions on Moneycontrol or download the Moneycontrol App to stay updated!
Find the best of Al News in one place, specially curated for you every weekend.
Stay on top of the latest tech trends and biggest startup news.


