After staying in the red through the last four sessions, the Nifty managed to close in the green on September 25. The index closed below its 20-day SMA (simple moving average) for the second consecutive session and advance decline remained almost same with 1:1 ratio on the BSE.
The Nifty Midcap100 index outperformed the Nifty with 0.66 percent gain, while Nifty Smallcap100 traded in sync with the benchmark with almost a flat closing. The Nifty IT, Media and Pharma remained the losers, while Reality, Financial Services and Consumer Durables remained the gainers from the sectoral indices.
The Nifty formed a Doji candlestick pattern on the daily chart, which indicates indecision after the running correction. The benchmark found support on an upward sloping trendline adjoining the swing lows of March 2023 and September 2023. The 50-day EMA (exponential moving average) for the Nifty is currently placed at 19550 odd levels.
Indicators like RSI (relative strength index), MACD (moving average convergence divergence) and DMI (directional movement index) have been showing sign of weakness in the benchmark index. If we apply disparity index of 200-day EMA on Nifty, then we can observe the development of the negative divergence by that oscillator on the daily chart. So, for an intermediate bullish trend to hold, the Nifty has to sustain above the crucial support of 19,550.
Any level below 19,550 could intensify the selling pressure which could drag the Nifty towards the next support of 19,300. It is advisable to hold long positions with the strict stop-loss of 19,550 in Nifty spot.
On the higher side, the band of 19,800-19,850 could offer a resistance in the Nifty. We expect PSU bank, fertilizers and sugar sectors to outperform the market in the short term.
Here are three buy calls for next 2-3 weeks:
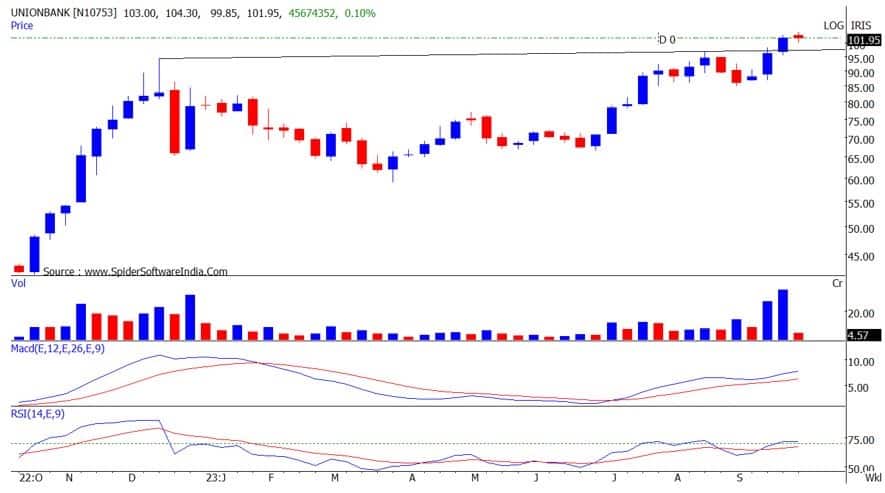
Union Bank of India: Buy | LTP: Rs 102 | Stop-Loss: Rs 93 | Targets: Rs 113-122 | Return: 20 percent
The stock price has broken out from upward sloping trendline on the weekly chart. It has also broken out from Inverted Head and Shoulder pattern on monthly chart. Price breakout is accompanied with jump in volumes.
The stock price is trading above its 20, 50 and 200 DMA (day simple moving average), indicating bullish trend on all time frame. Indicators and Oscillators like MACD and RSI have turned bullish on the weekly charts.
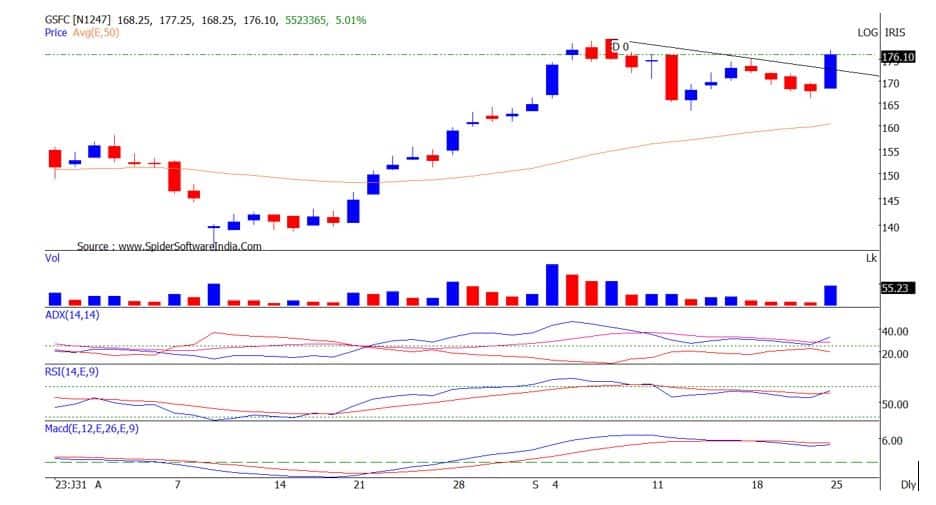
Gujarat State Fertilizers & Chemicals (GSFC): Buy | LTP: Rs 176 | Stop-Loss: Rs 165 | Targets: Rs 190-202 | Return: 15 percent
The stock price has broken out from the symmetrical triangle pattern in the daily chart, which indicates continuation of an uptrend. Price breakout is accompanied with jump in volumes.
Primary trend of the stock is bullish as it has been holding above all important moving averages. Indicators and oscillators have turned bullish on the weekly chart.
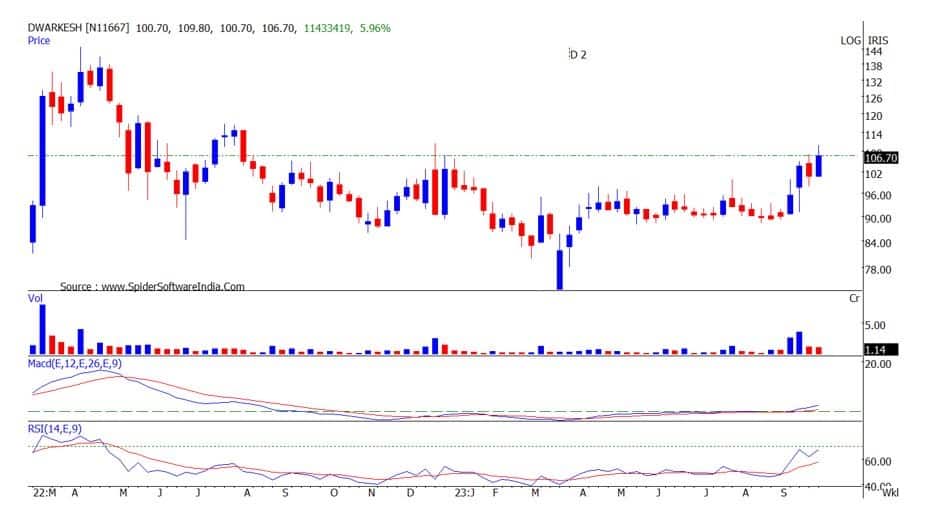
Dwarikesh Sugar Industries: Buy | LTP: Rs 106.30 | Stop-Loss: Rs 99 | Targets: Rs 117-125 | Return: 18 percent
The stock price has broken out from the long term consolidation on its weekly charts. Price breakout is accompanied with jump in volumes. Stock is placed above all important moving averages, which indicates bullish trend on all time frame.
Indicators and oscillators have turned bullish daily and weekly charts. Sugar sector has started outperforming the broader markets.
Disclaimer: The views and investment tips expressed by investment experts on Moneycontrol.com are their own and not those of the website or its management. Moneycontrol.com advises users to check with certified experts before taking any investment decisions.

Discover the latest Business News, Sensex, and Nifty updates. Obtain Personal Finance insights, tax queries, and expert opinions on Moneycontrol or download the Moneycontrol App to stay updated!
Find the best of Al News in one place, specially curated for you every weekend.
Stay on top of the latest tech trends and biggest startup news.