March 2024 began with the Nifty reaching a fresh record high of 22,440. The index found support on the upward sloping trendline adjoining the swing lows of January 24 and February 14 and broke out from the ascending triangle pattern on the weekly chart, indicating continuation of an uptrend.
The Nifty has been forming higher tops and higher bottoms on the monthly charts, which indicates a bullish structure on medium-term time frame. Indicators and oscillators like MACD (moving average convergence divergence) and RSI (relative strength index) have turned bullish on the weekly and monthly charts.
Percentage of stocks above 200 DMA in the NSE500 index have been falling despite the rise in the Nifty500 Index. This shows the negative divergence and signs of caution in the Midcap and Smallcap space. Traders need to be vigilant and selective while dealing in the midcap and smallcap space. We can expect the broader market to underperform the benchmark.
FIIs still carry more shorts than longs in index futures, which could ignite further short-covering in the index. Seasonality chart of the last 15 years indicates that March has been a good month for the Nifty in terms of monthly returns.
Monthly ratio chart of the Nifty versus Nifty500 has reached an all-time low, which indicates good chances of mean reversion to happen. We expect the Nifty to outperform the broader markets from here. Monthly ratio chart of private sector bank versus Nifty has reached long-term support of horizontal trendline and we expect private banks to outperform the Nifty from here.
Bloomberg commodity index has reached long-term support of horizontal trendline, which indicates good chances of gold, crude and natural gas to rise from the current levels. Lok Sabha election trends in the last 25 years suggests possibility of the Nifty doing very well till results likely in May.
Geopolitical issues, especially wars, turned out to be an investment opportunity historically in India and the Indian markets seem to have absorbed the supply which came in October because of the Israel-Hamas standoff. The Nifty has yielded 17 percent since then. Going by that data, even conservative estimates could take the index towards 23,100-23,200 levels.
World Market indices like MSCI World and ACWI have registered fresh all-time highs which augers well for Indian markets.
Considering the evidences discussed above, we believe that the bullish trend in the Indian markets will continue and dips should be utilised to go long. The Nifty could extend its uptrend towards next resistances of 22,600-22,700 followed by 23,000-23,100. Supports for the Nifty are seen at 22,200 and 21,800.
Here are three buy calls for 2-3 weeks:
JK Lakshmi Cement: Buy | LTP: Rs 943 | Stop-Loss: Rs 878 | Target: Rs 1,023 | Return: 8.5 percent
The stock price has broken out from the consolidation which held in last three weeks. Price breakout is accompanied with jump in volumes. 50 DEMA (days exponential moving average) has been acting as a bullish reversal point for the stock for mast many weeks.
Primary trend of the stock is bullish with higher tops and higher bottoms on the weekly charts. Cement stocks have been outperforming for last couple of months.
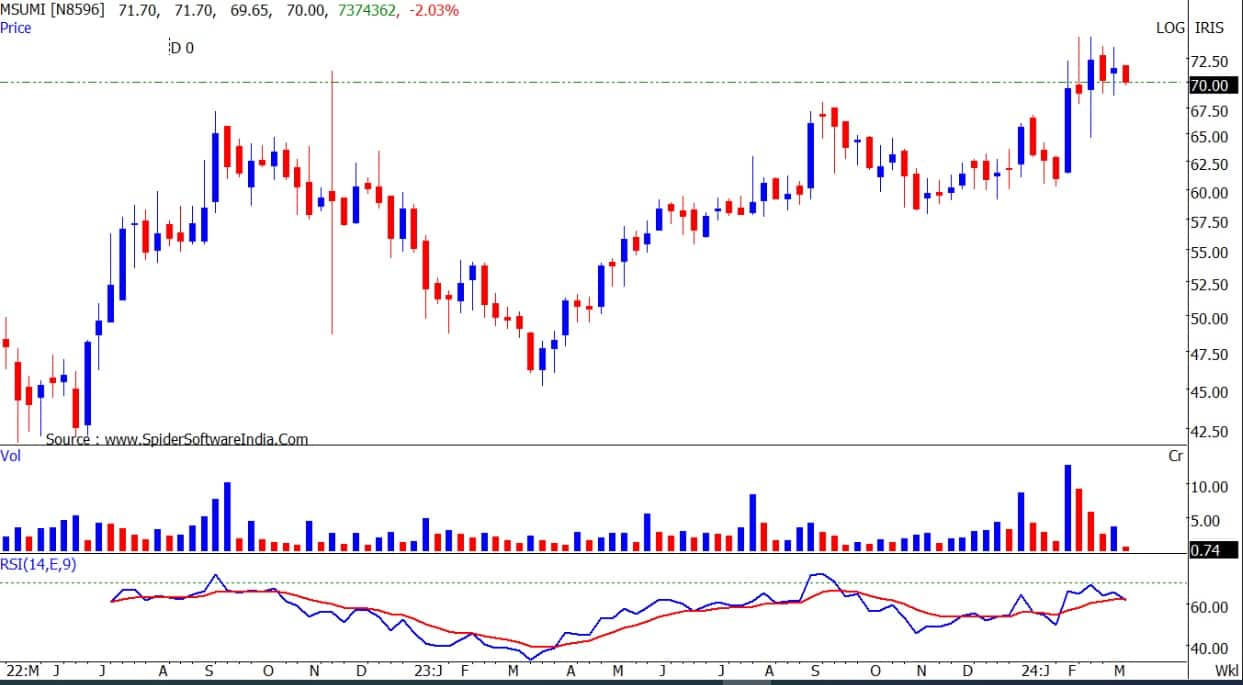
Motherson Sumi Wiring: Buy | LTP: Rs 69.95 | Stop-Loss: Rs 67.70 | Target: Rs 77.25 / Rs 84 | Return: 20 percent
The stock price has surpassed the crucial double top resistance of Rs 67 and has been sustaining above it. Primary trend of the stock has been bullish with higher tops and higher bottoms on the weekly chart.
The stock is placed above all important moving averages, indicating bullish trend on all time frames. Price rise is accompanied by rise in volumes. Indicators and oscillators have been showing strength in the current uptrend.
JTEKT India: Buy | LTP: Rs 160.45 | Stop-Loss: Rs 154 | Target: Rs 180 | Return: 12 percent
The stock price has broken out from “Flag” pattern on the weekly chart. It has also surpassed the crucial resistance of 50 DEMA, placed at Rs 154. Auto Ancillary sector has started outperforming.
The recent price rise in accompanied by jump in volumes. Indicators and oscillators have turned bullish on the daily chart.

Disclaimer: The views and investment tips expressed by investment experts on Moneycontrol.com are their own and not those of the website or its management. Moneycontrol.com advises users to check with certified experts before taking any investment decisions.

Discover the latest Business News, Sensex, and Nifty updates. Obtain Personal Finance insights, tax queries, and expert opinions on Moneycontrol or download the Moneycontrol App to stay updated!
Find the best of Al News in one place, specially curated for you every weekend.
Stay on top of the latest tech trends and biggest startup news.