The Nifty50 ended higher for the third straight session on November 6. At close, the Nifty was up 0.94 percent or 181.2 points at 19,412. Volumes on the NSE continued to be on the lower side. Broader market indices gained in line with the index even as the advance-decline ratio rose to 1.84:1 on the BSE.
The short-term trend in the Nifty turned positive as it has closed above its 5, 11 and 20-day EMA (exponential moving average). Indicators and oscillators like RSI (relative strength index), MACD (moving average convergence divergence) and DMI (directional movement index) have turned bullish on the daily charts.
In the Options segment, we have seen Put writing at 19,200-19,300. This level coincides with the 5 and 11-day EMA, which is placed at 19,232 and 19,249. Therefore, one may continue with/create fresh longs with the stop-loss at 19,200 levels.
On the higher side, the Nifty has got an immediate resistance around 19,600 levels, derived from the downward sloping trendline, adjoining the highs of September 15 and October 17, 2023. Far resistance is expected around 19,850 levels.
Broadly speaking, the Nifty is placed in the range of 19,200-19,850 levels. After running correction of nearly 8 percent from the October high, the Nifty Midcap and Smallcap indices resumed their primary uptrend as they have closed above their short term important moving averages. We advise keeping stock specific approach in midcap/smallcap space till the result season ends November 14.
Here are three buy calls for the next 3-4 weeks:
Orient Cement: Buy | LTP: Rs 208 | Stop-Loss: Rs 195 | Target: Rs 223-235 | Return: 13 percent
The stock price has broken out on the monthly chart by surpassing the multiple top resistance of Rs 185 odd levels. The stock price has been forming bullish higher top higher bottom formation on the weekly chart. Momentum indicators and oscillators are showing strength in the stock.

NMDC: Buy | LTP: Rs 160 | Stop-Loss: Rs 153 | Target: Rs 168-173 | Return: 8 percent
The stock price has broken out on the monthly chart by surpassing the resistance of Rs 140 odd levels. Primary trend of the stock is positive as stock price is placed above its 50, 100 and 200-day moving averages.
Momentum Indicators and Oscillators like RSI and MFI (money flow index) are sloping upwards and placed above 60 on the weekly chart, Indicating strength in the uptrend.

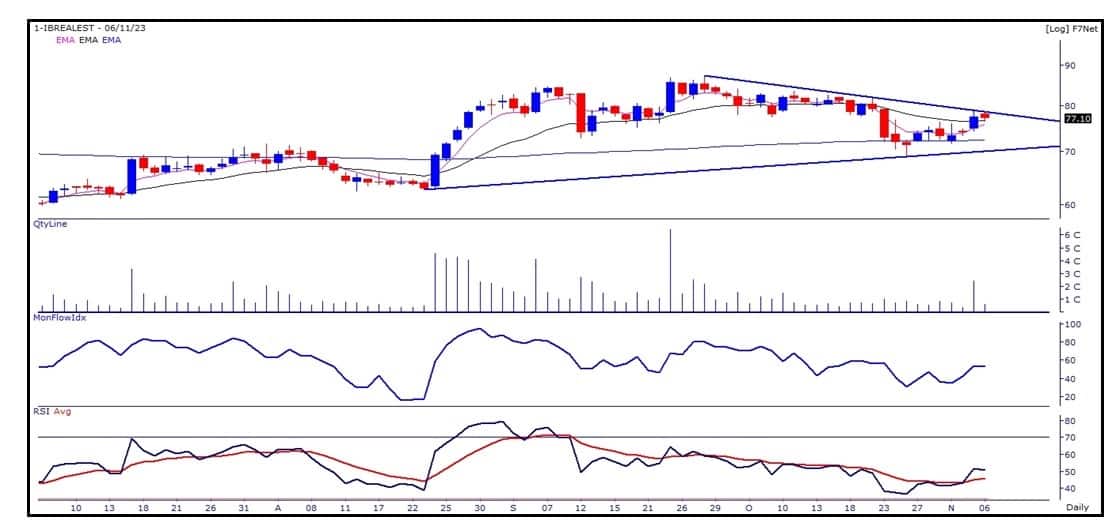
Indiabulls Real Estate: Buy | LTP: Rs 77.10 | Stop-Loss: Rs 71 | Target: Rs 84-88 | Return: 14 percent
After taking support at 200-day EMA (exponential moving average), the stock price reversed northwards to close above its 5 and 11-day EMA. Stock price is on the verge of breaking out from the downward sloping trendline, adjoining the highs of September 28 and November 3, 2023.
Momentum Indicators and Oscillators like RSI and MFI are sloping upwards and placed above 50 on the daily chart, Indicating strength in the uptrend.
Disclaimer: The views and investment tips expressed by investment experts on Moneycontrol.com are their own and not those of the website or its management. Moneycontrol.com advises users to check with certified experts before taking any investment decisions.

Discover the latest Business News, Sensex, and Nifty updates. Obtain Personal Finance insights, tax queries, and expert opinions on Moneycontrol or download the Moneycontrol App to stay updated!
Find the best of Al News in one place, specially curated for you every weekend.
Stay on top of the latest tech trends and biggest startup news.