
Nifty has been consolidating for last few days as the benchmark index is taking a pause from a rally over the past two months of 15 percent. However, Nifty continues to be in the up trend as it has closed above the previous congestion high on the daily chart.
Besides, the important moving averages are staying comfortably below the current index value, confirming the up trend.
The weekly RSI (relative strength index) is in bullish crossover with a reading of just below 60, suggesting room for further upside over the short term.
The trend may remain bullish over the short term as long as it remains above 17,350. Below 17,350, the index may drift down towards 17,000 where crucial support is pegged. On the higher end, resistance is visible at the falling trend line drawn by connecting the swing highs on the daily timeframe.
However, the rally towards 17,750-17,800 is likely to attract selling pressure at the higher levels. Only a decisive breakout above 17,800 may induce next leg of stronger rally.
Here are three buy calls for next 2-3 weeks:
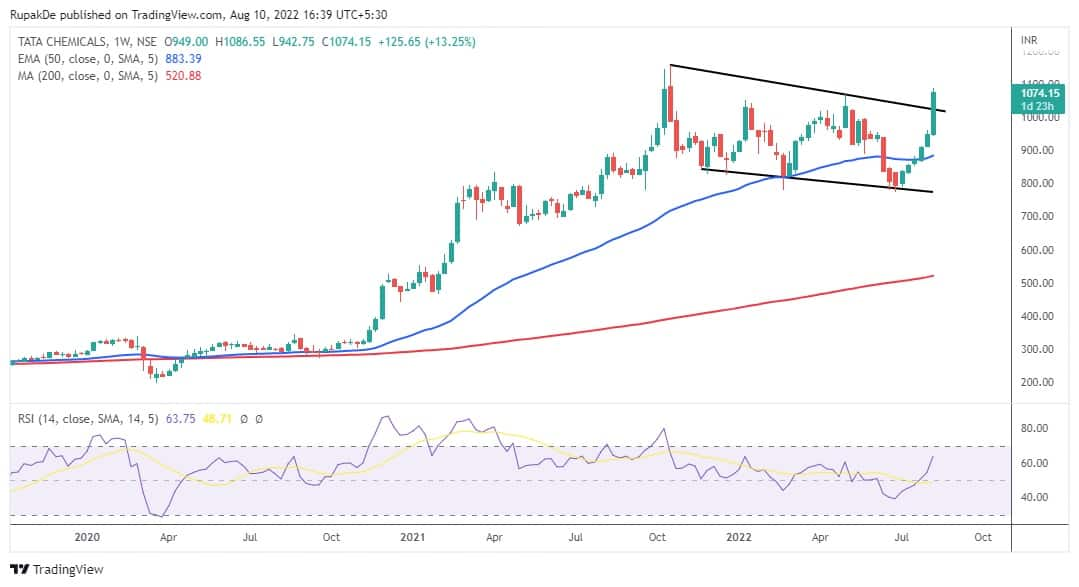
Tata Chemicals: Buy | LTP: Rs 1,074 | Stop-Loss: Rs 950 | Target: Rs 1,370 | Return: 27 percent
The stock has given a trend channel breakout on the weekly timeframe suggesting a rise in bullishness. Besides, the stock has given a reversal confirmation by moving above the previous swing high on the daily chart.
The breakout is backed by staggering increase in volume. The weekly RSI is in bullish crossover with a reading of 63, suggesting a bullish momentum over the medium term.
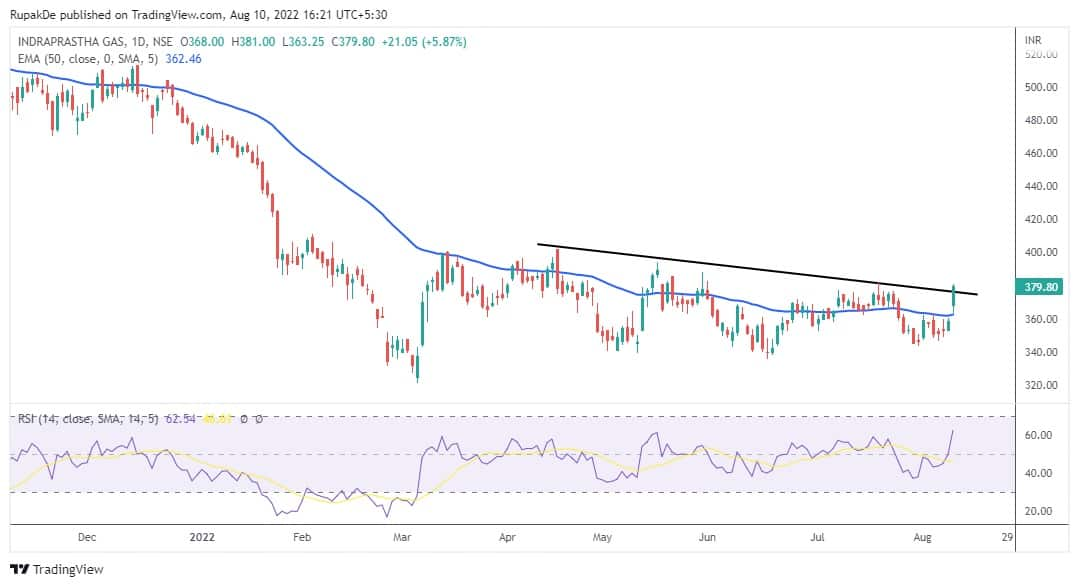
Indraprastha Gas: Buy | LTP: Rs 380 | Stop-Loss: Rs 347 | Target: Rs 450 | Return: 18 percent
The bulls have started to take control in the stock as the price has moved above its previous swing high on the daily chart. Also, a falling trend line breakout on the daily chart suggests that the preceding downtrend has ended and a new up trend has begun.
Over the short term, the up trend is likely take the stock higher towards 520.
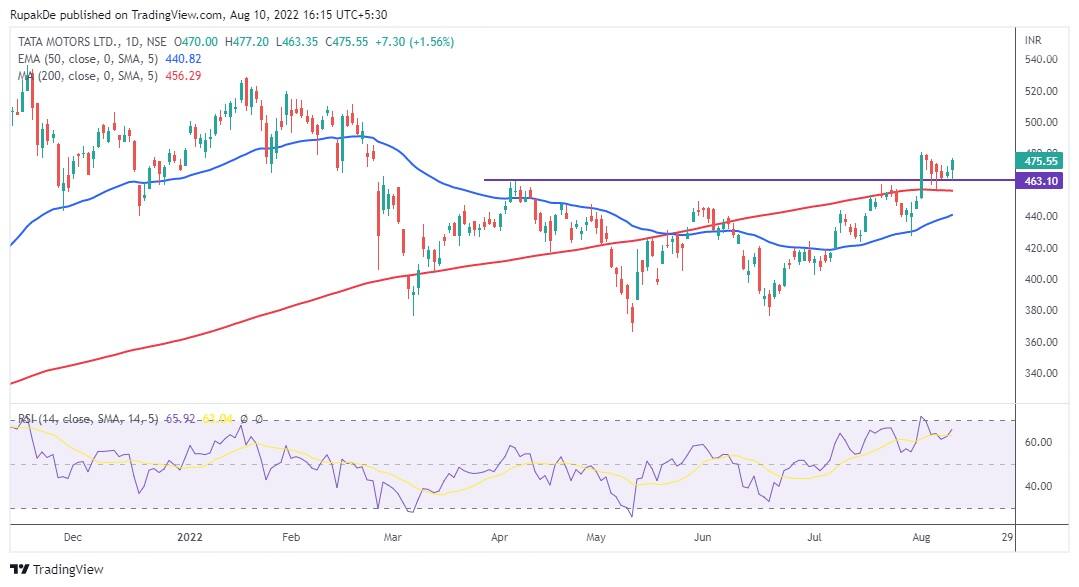
Tata Motors: Buy | LTP: Rs 475.55 | Stop-Loss: Rs 455 | Target: Rs 520 | Return: 9 percent
The stock is in "higher top higher bottom" formation on the daily chart which shows an up trend. Besides, the price has taken support at the 200-day moving average before the recent rally.
The current rally, therefore, is likely to be in force as long as it remains above 200DMA. The momentum oscillator is in bullish crossover on the daily and weekly timeframe.
Disclaimer: The views and investment tips expressed by investment experts on Moneycontrol.com are their own and not those of the website or its management. Moneycontrol.com advises users to check with certified experts before taking any investment decisions.

Discover the latest Business News, Sensex, and Nifty updates. Obtain Personal Finance insights, tax queries, and expert opinions on Moneycontrol or download the Moneycontrol App to stay updated!
Find the best of Al News in one place, specially curated for you every weekend.
Stay on top of the latest tech trends and biggest startup news.